About AWS EC2 performance - beam.smp high cpu usage

Hi all, I’m new to the forum and also new to erlang.

Let’s see if anyone can help me!

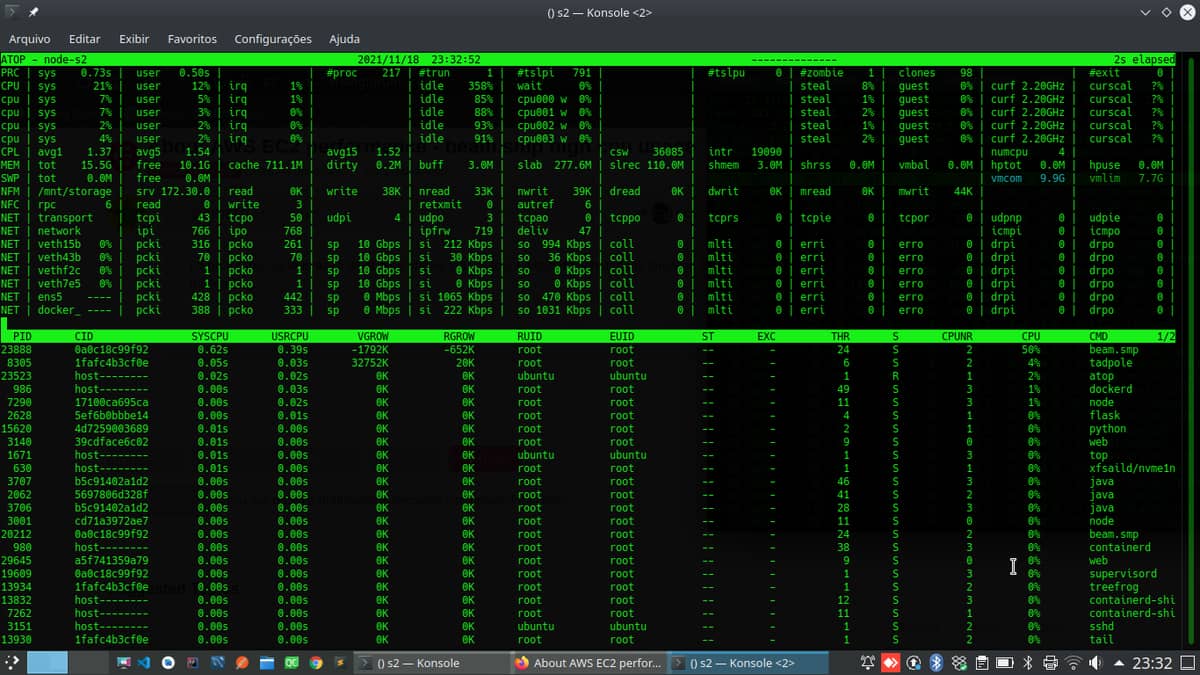
I have a web application running with OTP 21 (Chicagoboss) using docker swarm. When I run this application on my local machine, its processing consumption is very low. However, when I run the same docker on an EC2 t3a.xlarge server the consumption is very high, exceeding 100% CPU usage at all times.

I tried to add some parameters in vm.args

+sbwt none
+sbwtdcpu none
+sbwtdio none
+sfwi 0
+scl false
-smp

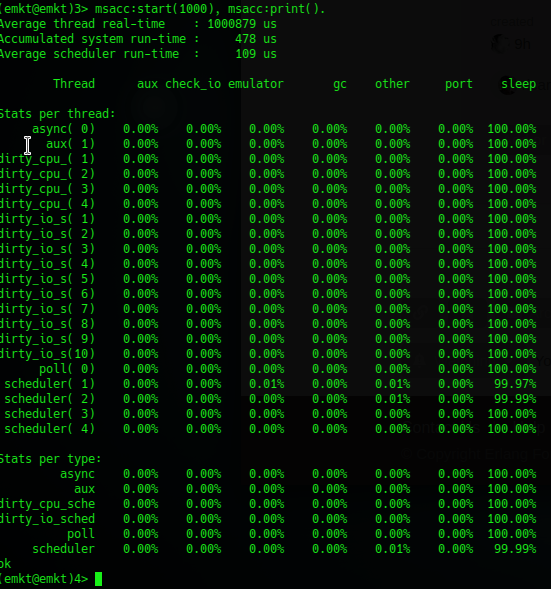
This had little effect. This application is 90% idle, and occasionally processes something that arrives using a crontab library.

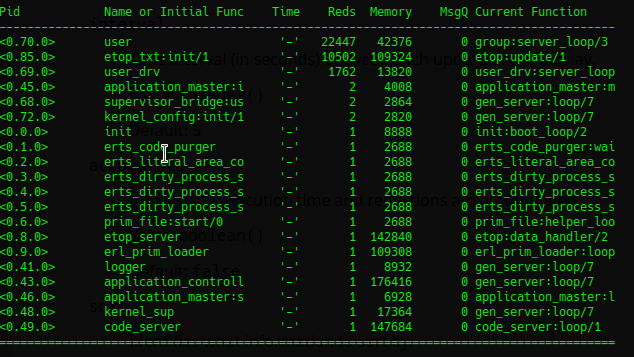
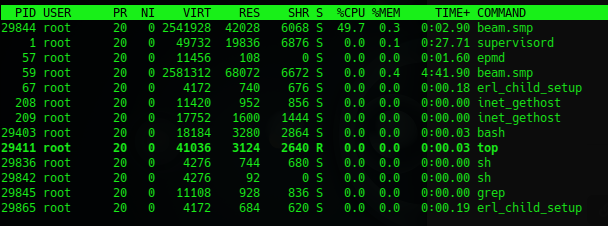
The process that consumes processing is beam.smp.

Do you have an explanation for this behavior?

Thanks!

5 Likes

I am not an expert of EC2, but can you describe some more details about you application ? What kind of database are you using? Mnesia or other DBs?

3 Likes

-sfwi 0 has no effect, and it’s also the default.
I think -smp also has no effect for OTP 21.

I think that +scl false should not be used either (although it likely to have little to no effect for your case).

Next step to understand what the VM is doing requires a remote shell (remsh). I don’t have any experience with Chicagoboss, but there should be some way to use erl -remsh node@yourhost. Within that shell you can try listing running processes, and use process_info to see their reductions, or use msacc:start(1000), msacc:print(). to view microstate accounting information.

Alternative is to use etop (Erlang top) within that shell.

4 Likes

Hi, thanks for replying!

About the application.

There are two applications. An application is used to identify when a particular service is down. It has a web management area, where paths to sites to be checked are registered. Based on these sites, a job runs every 5 minutes to check the status, sending notifications in case of failures. The database is mysql. The job lib is GitHub - b3rnie/crontab: crontab for Erlang.

The other application is an email template manager, with the same features. But instead of tracking site states, it occasionally sends out emails based on the templates.

Both have the same problem.

2 Likes

Hi, thanks for replying!

I will check these questions and post again.

2 Likes

Yes, Chicago Boss has a erl shell. I used etop, and that was the output limiting to 20 lines.

Screenshot_20211118_000434

3 Likes

Everything looks normal from that image. Could you post the results of the msacc commands that @max-au posted?

5 Likes

Hi,

Screenshot_20211118_095512

3 Likes

Everything looks very normal from that as well. How do you measure the high cpu utilization?

2 Likes

I check using the top

Screenshot_20211118_110440

The process is always fluctuating from 20% to 50% CPU usage. I had to limit the docker of this service to use a maximum of 50% of the processor, otherwise it has peaks of 130%. This is strange, as when I run it on my local machine it hardly goes beyond 5% usage.

It could be a mistake I’m making, but I can’t identify it.

2 Likes

I’d be terribly curious as to what atop shows you vs top. I wonder if what top is showing here is misleading.

2 Likes

atop from docker

atop from server

1 Like

The top is not wrong, because I had been paying CPU credits until I found out that this process was consuming all the processing. Apparently it must be related to the type of machine on amazon.

The two applications I have don’t use advanced erlang features. After some study of the language, I wanted to use it in a real project to see how it behaved.

The point is: I have lots of applications using different languages and frameworks, and I haven’t had any performance issues, at least not while they’re idle. What kind of cpu/cloud do I need so this doesn’t happen?

In another group someone suggested that I get a dedicated machine. However, the cost of this is very high, especially since I am Brazilian and paid in dollars. In that case I couldn’t think of this language as a general use?

2 Likes

You are hitting some bug somewhere that causes the high CPU usage. The behavior you are seeing is not normal. All of the tools that look at things from the Erlang point of view say that you are not using any CPU, while the OS reports that you actually do. So something is causing that CPU utilization, if you have the time we can try to figure out what it is, though I don’t know much about running things on Amazon EC2 so it may take a while.

Anyway, in the top you posted there are two beam.smp (that is Erlangs VMs). One that had pid 59 and one that had pid 29844. Do you know what the two different Erlangs are doing?

3 Likes

I have time and I want to solve it! I want to deepen my knowledge of erlang. Thanks a lot for the help.

About the two beam.smp I can’t say. I just start the application as the framework documentation says. Should there be only one?

From what I’ve already researched, this problem happens frequently when there is a bug in some process. I found a lot of stuff related to RabbitMQ and high cpu consumption.

I’ll put the bootstrap of my application here:

webmon_init.erl

-module(webmon_init).
-compile(export_all).

init() ->		
	application:ensure_all_started(jwt),
	bootstrap:init(),
	job:start().

job.erl

-module(job).
-export([start/0, site_monitor_start/0]).

start() ->
	inets:start(), 
	ssl:start(),
	ok = application:start(crontab),
	MFA = {job, site_monitor_start, []},
	Minutes = lists:seq(1, 60, 1), % each 3 minutes
	Minutes2 = lists:sublist(Minutes, 1, length(Minutes) - 1), % remove minute 60, max 59
	ok = crontab:add(pntc, ['*', '*', '*', '*', Minutes2], MFA).

site_monitor_start() ->
	% code

The bootstrap:init() only check database default values (tenant, user).

If you say that this behavior is abnormal there must be some bug in my application. I will keep doing more tests to try to find out. I really liked erlang a lot, and I don’t want to stop using it due to ignorance. =D

3 Likes

It is a bug somewhere, not sure where yet :slight_smile:

Yes, there should only be one. One of them may be the remote shell connecting to the node, but to make sure can you run ps aux | grep beam? From that output we should be able to see what the processes are doing.

There can be many reason for it, which is why it is hard to debug. Since msacc showed very little usage I do not think that it is a runaway erlang process that is the problem as it would show up there.

5 Likes

High CPU usage can happen even with low reported by the BEAM (last I had an experience with this) if a mailbox gets too big in certain code paths or if there is too much GC happening in a single very active process. Do any mailbox sizes or process allocated memory seem unusually large?

1 Like

What did you use to measure low usage reported the Erlang?

2 Likes

Just via normal top and /proc/$PID/stat and such. On erlang side I used observer.

2 Likes

I didn’t suggest it was wrong, but perhaps misleading. In searching for a similar issue I did find several instances where what top reported was misleading. I think since you’ve tried atop, it’s not misleading.

As other have pointed out, this is not normal behavior and it suggests a bug in your app. What’s more, not only a possible bug in your code, but could be a bug in a dep your using, or a dep of that dep. Just like in any other language ecosystem :slight_smile:

You definitely don’t need dedicated hardware. About every single project I’ve ever worked on has been in the cloud, some in AWS for that matter, and I never had issues.

To note Erlang/OTP and languages such as Elixir built on top of Erlang are very much general purpose. There’s a myriad of companies using Erlang in production and in the cloud.

You said you had to limit docker? Are these apps actually running inside docker containers? It doesn’t look like it from the screenshots, but I’d be remiss not to ask.

2 Likes