Allocator tweak suggestions (ETS/binary)

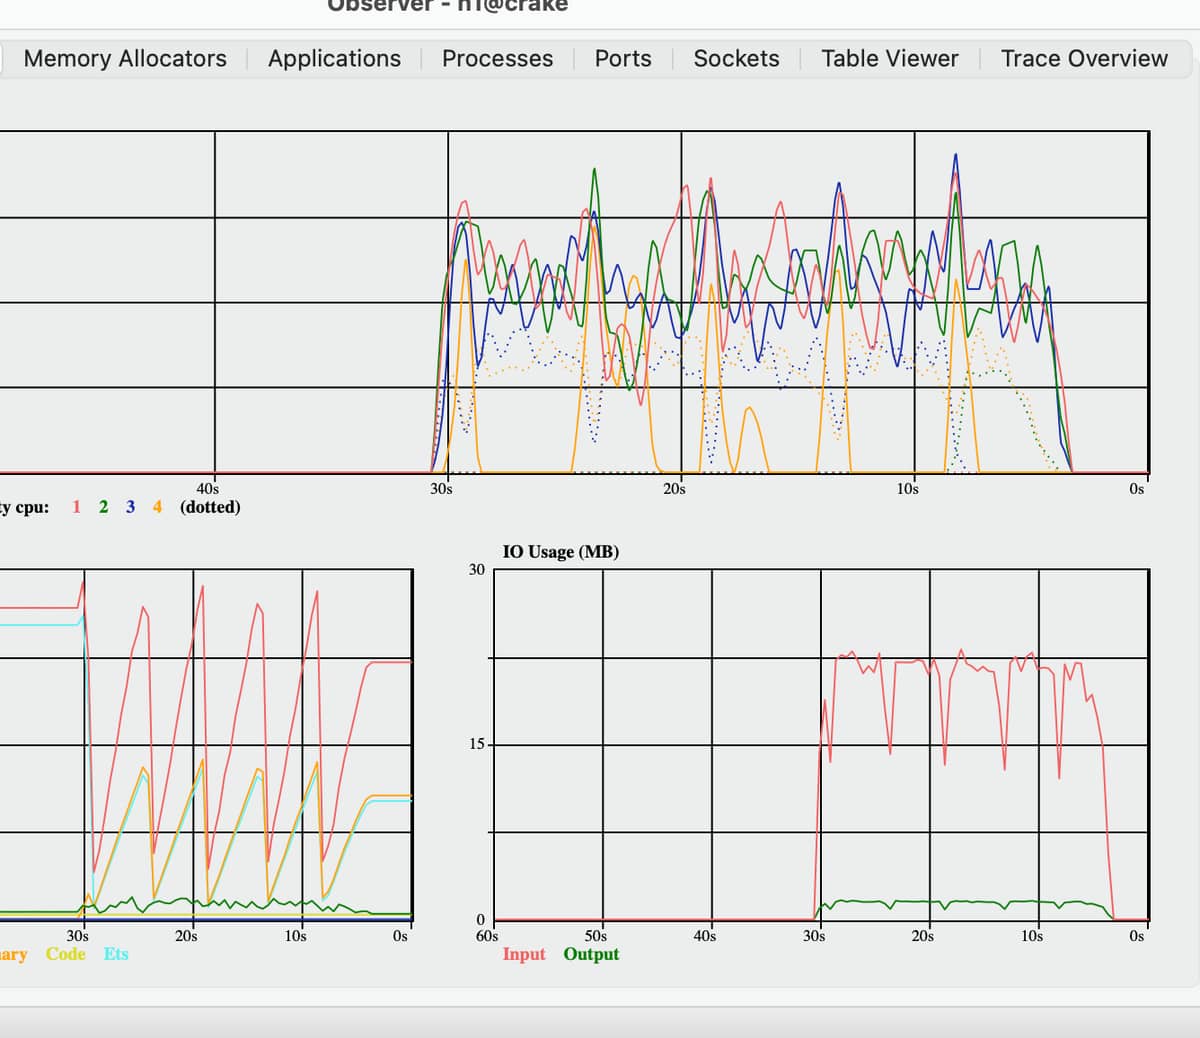
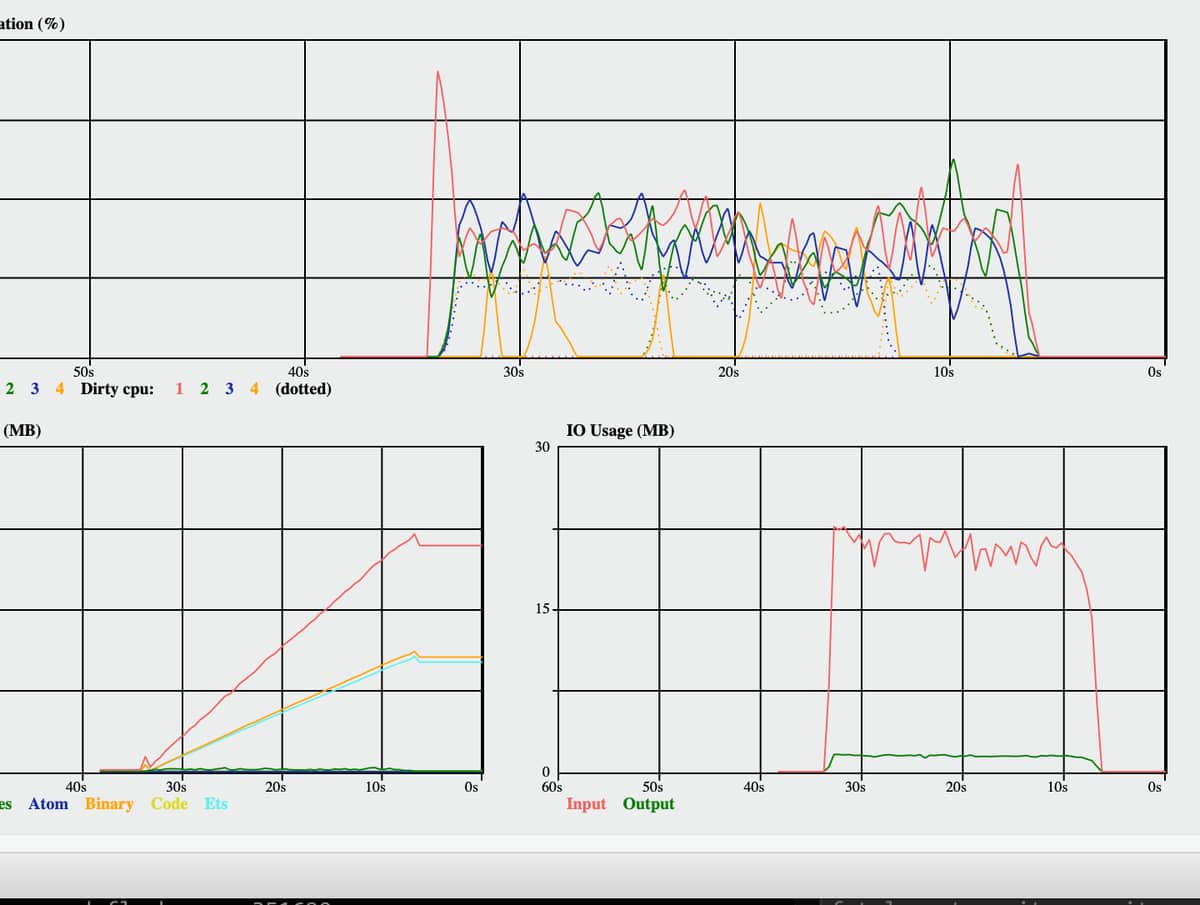
I (RabbitMQ/Ra) has a resource profile where lots of entries are written and read from an ETS (set) table. Each key is unique so the table will grow in size until it reaches some limit, at which point it will be deleted. Often the terms written contain binaries that get allocated on the large binary heap. This pattern results in a saw=tooth like memory profile.

I’m wondering what memory allocator (ETS and binary) tweaks I should try for this kind of profile. I tried using the erts_alloc_config tool and it spat out the following config but I am not sure it captured the saw tooth memory use pattern very well.

The main issue I have is that the whole system seems to degrade substantially when the ETS tables are deleted. Our tests see a regular though-put dip and if I amend the code so that the ETS tables are not deleted this dip is reduced or almost completely go away. I am guessing it has something to do with the amount of work done when freeing all that memory. Any advice would be greatly appreciated of course.

3 Likes

Hello!

erts_alloc_config has not been updated in quite a while, so the results you get from it will most likely not help you.

How easy is it for you to reproduce? Have you measured microstate accounting stats during the throughput dip? with extra statistics counters? What about running perf while the problem is happening?

From what you have described so far, nothing points towards this being a problem that can be solved by tuning the memory allocators.

2 Likes

Hi,

I have used lcnt, msacc (with extras) and profiled with perf but there is nothing sticking out (I can re-run and prepare output if worthwhile). All I can see from perf is that deleting an ETS table with ~600k entries (+ the same number of 256 byte binaries) is an expensive operation. It takes around 350ms on my linux box. This is fair enough but I don’t see why it should affect the rest of the system as much as it does on a fast multi-core machine. At the point the ETS table is being deleted it is no longer read or written to by any other process so there should not be any contention there that would block it. The table uses write_concurrency. The delete happens by a dedicated owner process that is never called into.

Because I can’t see anything else and the process does de-allocate a lot of data quickly is why I wanted to see if there were more optimal allocator settings for this kind of use case but I’ll take any further advice on anything :slight_smile:

2 Likes

Have you tried to lower the priority of the process that does the deletion of the ets table?

2 Likes

Good idea. Just tried it but it behaves similarly. Here is the Load Chart for the run (with a lower process priority). the IO usage is pretty much what we see from the system from the outside too.

Here is the load chart with the ets delete commented out:

Here is a flamegraph from a perf run (with ets delete enabled):

EDIT some lcnt output:

(n1@nkarl-a02)2> lcnt:conflicts().
                       lock  id  #tries  #collisions  collisions [%]  time [us]  duration [%]
                      ----- --- ------- ------------ --------------- ---------- -------------
                  run_queue   8 1177817         1334          0.1133       2074        0.0415
             alcu_allocator  10   24796           32          0.1291       1078        0.0216
                  proc_main  84  107670           48          0.0446        348        0.0070
                proc_status  84  196224           45          0.0229        243        0.0049
                  proc_msgq  84 1215492          866          0.0712         90        0.0018
 dirty_run_queue_sleep_list   2   29861            8          0.0268         11        0.0002
ok
(n1@nkarl-a02)3> lcnt:swap_pid_keys().
ok
(n1@nkarl-a02)4> lcnt:conflicts().
                       lock  id  #tries  #collisions  collisions [%]  time [us]  duration [%]
                      ----- --- ------- ------------ --------------- ---------- -------------
                  run_queue   8 1177817         1334          0.1133       2074        0.0415
             alcu_allocator  10   24796           32          0.1291       1078        0.0216
                 ra_log_wal   5  567336           50          0.0088        411        0.0082
      ra_log_segment_writer   5   16768           34          0.2028        145        0.0029
                         t1   5 1025747          875          0.0853        115        0.0023
 dirty_run_queue_sleep_list   2   29861            8          0.0268         11        0.0002
2 Likes

If it is the deletion that interferes with operations, maybe it is a good idea to slow that deletion down by doing it manually? That is deleting elements manually from the table before dropping the table?

Besides that, the only thing I can think of is to use an allocation strategy with a smaller overhead, which would be something like gf (goodfit) or ageffcaoff (age order first fit carrier address order first fit). Not sure if it will make any large difference though.

2 Likes

I tried getting all the keys then deleting them one by one which made overall table delete times about twice as long but this made the system perform worse overall. I then inserted an erlang:yield/0 in between each ets:delete/2 and this made it so slow it did actually even out the work but ultimately made overall throughput a lot worse and choppy. I don’t think this is a scheduling issue as there is plenty of capacity to run stuff.

I then tried all the allocation strategies in turn and apart from aoffcbf, ageffcbf and gf they tended to make ets:delete/1 slower and affect the system more, which is interesting in itself.

A couple of data points which I don’t know if they change anything: The process that writes to the ETS tables isn’t the process that deletes them. There are a lot of ETS writes to other tables whilst older tables are being deleted.

2 Likes

Here is an msacc capture that should at least have covered 1 ets delete:

(n1@crake)5> msacc:print().
Average thread real-time    :  5128803 us
Accumulated system run-time : 17909381 us
Average scheduler run-time  :  3066366 us

        Thread    alloc      aux      bifbusy_wait check_io emulator      ets       gc  gc_full      nif    other     port     send    sleep   timers

Stats per thread:
     async( 0)    0.00%    0.00%    0.00%    0.00%    0.00%    0.00%    0.00%    0.00%    0.00%    0.00%    0.00%    0.00%    0.00%  100.00%    0.00%
       aux( 1)    0.01%    0.21%    0.00%    0.00%    0.07%    0.00%    0.00%    0.00%    0.00%    0.00%    0.01%    0.00%    0.00%   99.70%    0.00%
dirty_cpu_( 1)    0.00%    0.00%    0.00%    0.00%    0.00%    0.00%    0.00%    0.00%    0.00%    0.00%    0.00%    0.00%    0.00%  100.00%    0.00%
dirty_cpu_( 2)    4.03%    0.00%    0.00%    9.72%    0.00%    0.08%    0.00%    9.61%    6.85%    0.00%    0.03%    0.00%    0.00%   69.68%    0.00%
dirty_cpu_( 3)    1.90%    0.00%    0.00%    4.72%    0.00%    0.04%    0.00%    5.23%    3.38%    0.00%    0.02%    0.00%    0.00%   84.72%    0.00%
dirty_cpu_( 4)    1.92%    0.00%    0.00%    4.95%    0.00%    0.04%    0.00%    5.40%    3.87%    0.00%    0.02%    0.00%    0.00%   83.81%    0.00%
dirty_io_s( 1)    0.00%    0.00%    0.00%    0.00%    0.00%    0.00%    0.00%    0.00%    0.00%    0.00%    0.00%    0.00%    0.00%  100.00%    0.00%
dirty_io_s( 2)    0.00%    0.00%    0.00%    0.00%    0.00%    0.00%    0.00%    0.00%    0.00%    0.00%    0.00%    0.00%    0.00%  100.00%    0.00%
dirty_io_s( 3)    0.03%    0.00%    0.00%    3.00%    0.00%    0.07%    0.00%    0.00%    0.00%   16.13%    0.05%    0.00%    0.00%   80.72%    0.00%
dirty_io_s( 4)    0.04%    0.00%    0.00%    2.57%    0.00%    0.08%    0.00%    0.00%    0.00%   14.91%    0.06%    0.00%    0.00%   82.34%    0.00%
dirty_io_s( 5)    0.00%    0.00%    0.00%    0.00%    0.00%    0.00%    0.00%    0.00%    0.00%    0.00%    0.00%    0.00%    0.00%  100.00%    0.00%
dirty_io_s( 6)    0.00%    0.00%    0.00%    0.00%    0.00%    0.00%    0.00%    0.00%    0.00%    0.00%    0.00%    0.00%    0.00%  100.00%    0.00%
dirty_io_s( 7)    0.00%    0.00%    0.00%    0.00%    0.00%    0.00%    0.00%    0.00%    0.00%    0.00%    0.00%    0.00%    0.00%  100.00%    0.00%
dirty_io_s( 8)    0.03%    0.00%    0.00%    2.14%    0.00%    0.05%    0.00%    0.00%    0.00%   11.56%    0.04%    0.00%    0.00%   86.17%    0.00%
dirty_io_s( 9)    0.00%    0.00%    0.00%    0.00%    0.00%    0.00%    0.00%    0.00%    0.00%    0.00%    0.00%    0.00%    0.00%  100.00%    0.00%
dirty_io_s(10)    0.00%    0.00%    0.00%    0.00%    0.00%    0.00%    0.00%    0.00%    0.00%    0.00%    0.00%    0.00%    0.00%  100.00%    0.00%
      poll( 0)    0.00%    0.00%    0.00%    0.00%    0.00%    0.00%    0.00%    0.00%    0.00%    0.00%    0.00%    0.00%    0.00%  100.00%    0.00%
 scheduler( 1)   12.09%    0.98%    7.67%   14.15%    0.66%   11.91%    3.47%    1.99%    0.20%    0.02%    2.01%    5.31%    2.06%   37.47%    0.00%
 scheduler( 2)   10.84%    1.06%    7.80%   14.54%    0.64%   10.96%    3.58%    1.71%    0.14%    0.02%    1.93%    4.90%    1.90%   39.97%    0.00%
 scheduler( 3)   11.12%    0.97%    7.08%   17.24%    0.53%    9.42%    2.74%    1.73%    0.15%    0.02%    1.68%    4.00%    1.51%   41.80%    0.00%
 scheduler( 4)    1.24%    0.06%    0.60%    1.22%    0.05%    0.93%    2.00%    0.17%    0.02%    0.00%   35.08%    0.42%    0.15%   58.04%    0.00%

Stats per type:
         async    0.00%    0.00%    0.00%    0.00%    0.00%    0.00%    0.00%    0.00%    0.00%    0.00%    0.00%    0.00%    0.00%  100.00%    0.00%
           aux    0.01%    0.21%    0.00%    0.00%    0.07%    0.00%    0.00%    0.00%    0.00%    0.00%    0.01%    0.00%    0.00%   99.70%    0.00%
dirty_cpu_sche    1.96%    0.00%    0.00%    4.85%    0.00%    0.04%    0.00%    5.06%    3.52%    0.00%    0.02%    0.00%    0.00%   84.55%    0.00%
dirty_io_sched    0.01%    0.00%    0.00%    0.77%    0.00%    0.02%    0.00%    0.00%    0.00%    4.26%    0.02%    0.00%    0.00%   94.92%    0.00%
          poll    0.00%    0.00%    0.00%    0.00%    0.00%    0.00%    0.00%    0.00%    0.00%    0.00%    0.00%    0.00%    0.00%  100.00%    0.00%
     scheduler    7.93%    0.68%    5.17%   10.54%    0.42%    7.43%    2.84%    1.26%    0.12%    0.02%   13.12%    3.27%    1.26%   45.94%    0.00%
ok
2 Likes

And here is an msacc capture without the ets:delete/1. I note a substantial reduction in one scheduler’s “other” use compared to the previous capture.

(n1@crake)3> msacc:print().
Average thread real-time    :  5000506 us
Accumulated system run-time : 14613732 us
Average scheduler run-time  :  2239840 us

        Thread    alloc      aux      bifbusy_wait check_io emulator      ets       gc  gc_full      nif    other     port     send    sleep   timers

Stats per thread:
     async( 0)    0.00%    0.00%    0.00%    0.00%    0.00%    0.00%    0.00%    0.00%    0.00%    0.00%    0.00%    0.00%    0.00%  100.00%    0.00%
       aux( 1)    0.01%    0.21%    0.00%    0.00%    0.06%    0.00%    0.00%    0.00%    0.00%    0.00%    0.01%    0.00%    0.00%   99.70%    0.00%
dirty_cpu_( 1)    0.00%    0.00%    0.00%    0.00%    0.00%    0.00%    0.00%    0.00%    0.00%    0.00%    0.00%    0.00%    0.00%  100.00%    0.00%
dirty_cpu_( 2)    4.36%    0.00%    0.00%   11.15%    0.00%    0.09%    0.00%   11.57%    7.06%    0.00%    0.03%    0.00%    0.00%   65.74%    0.00%
dirty_cpu_( 3)    4.18%    0.00%    0.00%   10.59%    0.00%    0.08%    0.00%   10.85%    8.08%    0.00%    0.03%    0.00%    0.00%   66.19%    0.00%
dirty_cpu_( 4)    0.03%    0.00%    0.00%    0.10%    0.00%    0.00%    0.00%    0.02%    0.15%    0.00%    0.00%    0.00%    0.00%   99.69%    0.00%
dirty_io_s( 1)    0.00%    0.00%    0.00%    0.00%    0.00%    0.00%    0.00%    0.00%    0.00%    0.00%    0.00%    0.00%    0.00%  100.00%    0.00%
dirty_io_s( 2)    0.00%    0.00%    0.00%    0.00%    0.00%    0.00%    0.00%    0.00%    0.00%    0.00%    0.00%    0.00%    0.00%  100.00%    0.00%
dirty_io_s( 3)    0.00%    0.00%    0.00%    0.00%    0.00%    0.00%    0.00%    0.00%    0.00%    0.00%    0.00%    0.00%    0.00%  100.00%    0.00%
dirty_io_s( 4)    0.00%    0.00%    0.00%    0.02%    0.00%    0.00%    0.00%    0.00%    0.00%    0.06%    0.00%    0.00%    0.00%   99.91%    0.00%
dirty_io_s( 5)    0.00%    0.00%    0.00%    0.00%    0.00%    0.00%    0.00%    0.00%    0.00%    0.00%    0.00%    0.00%    0.00%  100.00%    0.00%
dirty_io_s( 6)    0.07%    0.00%    0.00%    3.98%    0.00%    0.12%    0.00%    0.00%    0.00%   23.78%    0.10%    0.00%    0.00%   71.96%    0.00%
dirty_io_s( 7)    0.03%    0.00%    0.00%    2.11%    0.00%    0.06%    0.00%    0.00%    0.00%   14.02%    0.05%    0.00%    0.00%   83.73%    0.00%
dirty_io_s( 8)    0.00%    0.00%    0.00%    0.00%    0.00%    0.00%    0.00%    0.00%    0.00%    0.00%    0.00%    0.00%    0.00%  100.00%    0.00%
dirty_io_s( 9)    0.00%    0.00%    0.00%    0.00%    0.00%    0.00%    0.00%    0.00%    0.00%    0.00%    0.00%    0.00%    0.00%  100.00%    0.00%
dirty_io_s(10)    0.00%    0.00%    0.00%    0.00%    0.00%    0.00%    0.00%    0.00%    0.00%    0.00%    0.00%    0.00%    0.00%  100.00%    0.00%
      poll( 0)    0.00%    0.00%    0.00%    0.00%    0.00%    0.00%    0.00%    0.00%    0.00%    0.00%    0.00%    0.00%    0.00%  100.00%    0.00%
 scheduler( 1)    9.52%    1.23%    7.97%   18.12%    0.75%   11.88%    2.75%    1.61%    0.06%    0.02%    2.29%    6.54%    1.98%   35.28%    0.00%
 scheduler( 2)    8.58%    0.98%    8.55%   14.00%    0.69%   11.85%    2.69%    1.93%    0.10%    0.02%    2.06%    6.03%    1.97%   40.53%    0.00%
 scheduler( 3)    7.35%    0.98%    7.08%   14.85%    0.61%   11.31%    2.04%    1.62%    0.11%    0.02%    1.83%    5.23%    1.95%   45.04%    0.00%
 scheduler( 4)    0.00%    0.00%    0.00%    0.02%    0.00%    0.00%    0.00%    0.00%    0.00%    0.00%    0.00%    0.00%    0.00%   99.98%    0.00%

Stats per type:
         async    0.00%    0.00%    0.00%    0.00%    0.00%    0.00%    0.00%    0.00%    0.00%    0.00%    0.00%    0.00%    0.00%  100.00%    0.00%
           aux    0.01%    0.21%    0.00%    0.00%    0.06%    0.00%    0.00%    0.00%    0.00%    0.00%    0.01%    0.00%    0.00%   99.70%    0.00%
dirty_cpu_sche    2.14%    0.00%    0.00%    5.46%    0.00%    0.04%    0.00%    5.61%    3.82%    0.00%    0.02%    0.00%    0.00%   82.91%    0.00%
dirty_io_sched    0.01%    0.00%    0.00%    0.61%    0.00%    0.02%    0.00%    0.00%    0.00%    3.79%    0.01%    0.00%    0.00%   95.56%    0.00%
          poll    0.00%    0.00%    0.00%    0.00%    0.00%    0.00%    0.00%    0.00%    0.00%    0.00%    0.00%    0.00%    0.00%  100.00%    0.00%
     scheduler    6.36%    0.80%    5.90%   11.75%    0.51%    8.76%    1.87%    1.29%    0.07%    0.02%    1.55%    4.45%    1.48%   55.21%    0.00%
2 Likes

busy_wait isn’t it some spin-lock contentions?

2 Likes

When deallocation of memory happens, the block that represented that memory has to be sent to the original scheduler that allocated the block. This is done through a queue in between schedulers. Handling of that queue would show up as “other”. If you deallocate a lot of items, then there will be a lot of messages sent in between schedulers.

One theory about what is happening is that it is handling of the memory deallocations that effect the throughput. There is no config option to change the priority of handling that work in relation to running processes.

This is the define that controls how many delayed deallocs are done per process re-schedule: otp/erts/emulator/beam/erl_alloc_util.c at 19a51d21179f7ca07eb90d23ef749cdb52cca141 · erlang/otp · GitHub

I don’t think it will change the behaviour you see if you lower it, but it may be worth trying to just to make sure.

3 Likes

Thank you this explanation makes a lot of sense. I did try to lower the define suggested but it didn’t make a lot of difference in my tests.

Is the delayed dealloc queue taken into account when it comes to scheduler work allocation?

2 Likes

There is no logic that specifically takes it into account, but since almost all of the scheduler balancing is done through work-stealing I think that it should balance itself out.

3 Likes

Thank you. Looks like there isn’t much else we can do at this point. :slight_smile:

I might have to start thinking about alternative designs for the Ra log storage system that don’t use ETS for short lived high-throughput “memtables”.

2 Likes

If you have a small example that I could run I may have some time to have a look and see if I can find something.

2 Likes

That’d be great if you have time, thank you. This is what I do to test:

Using the Ra repo with the wal-micro-optimisations branch: GitHub - rabbitmq/ra at wal-micro-optimisations

make shell SHELL_OPTS="-sname n1"

And in another shell:

make shell SHELL_OPTS="-sname load +S 2"

In the second shell run something like:

    ra_bench:run(#{data_size => 256,degree => 5,name => t1,
                   nodes => [n1@crake],
                   pipe => 1000,seconds => 60,target => 80000}).

And it should print the per second throughput out with regular dips:

starting servers on [n1@crake]
running bench mark...
ops/sec: 0
ops/sec: 129469
ops/sec: 127126
ops/sec: 129561
ops/sec: 127812
ops/sec: 105128
ops/sec: 104825
ops/sec: 124298
ops/sec: 124309
ops/sec: 128994
ops/sec: 122312
ops/sec: 93287 <-----
ops/sec: 126074
ops/sec: 127410
ops/sec: 123817
ops/sec: 128338
ops/sec: 95049 <----
ops/sec: 104934
ops/sec: 124760
ops/sec: 123884
ops/sec: 128272
ops/sec: 117145
ops/sec: 89406 <---
ops/sec: 129459
ops/sec: 127410
ops/sec: 126524

2 Likes

I did some quick digging and it seems like my hypothesis regarding delated de-alloc is correct. When running perf just as the ets:delete happens there is a lot of handle_delayed_dealloc calls happening.

The number of ops/sec that I got fluctuated a lot more than what you have in your example though, so not sure if I would draw too many conclusions from my tests.

3 Likes

Thank you for testing this. There are many other variables, disk speeds etc that affect the throughput variability apart from the ets:delete/1 but on my system I can’t see anything else poke out obviously.

If you think if anything else we could try to mitigate the impact of this I’m all ears!

Ha en bra helg

1 Like

I talked a bit with the team and we don’t have any great suggestions about how to solve this. There is a lot of work that needs to be done when deallocating such a large table.

Some ideas that may not work for you are:

  1. Make the table smaller… smaller table means less work to be done at once
  2. Make the binary into a list, will halve the number of deallocation, but use more memory. (You could also split the binary into 63 bytes chunks if that is better…).
  3. Create a process using a min_heap_size that can fit the cache. Though you still will get the deallocations for the binaries, unless you combine this with suggestion 2.
  4. Bind the process doing ets:insert and ets:delete to a scheduler using the undocumented and unsupported spawn_opt(M,F,A,[{scheduler,1}]). I don’t really recommend doing this, as it may have other nasty side effects, but could be fun to try and see if it helps.

Hard to know if any of them could work for you.

4 Likes

Thanks for remembering I asked about this and bringing it up.

We do play around with smaller tables and it does help a bit but there is another tradeoff in play as well where we don’t want the tables to get too small as then we may end up with greater than necessary write amplification in Ra.

As terms used in Ra is dependent on the machine implementation there isn’t that much we can do w.r.t changing the format of the data.

I do appreciate that the deallocation work needs to be done. One thing I did think about is whether the order of items in the delayed dealloc queue has any bearing on the amount of work done.

For example:

Say a scheduler allocates a set of binaries and these are then deleted (freed) by some other scheduler in quick succession (or even by the same scheduler). Does the order of “deletes” affect how efficiently the allocators work? E.g. if we freed the binaries in the order or reverse order they were allocated would this have any effect. It is hard to measure by experiment as it is delayed of course.

Just a thought.

Cheers

1 Like