BEAM on 128-core Linux box seeming not to use many of available cores

Hello all, I’m doing a bit of POC work for a potential project and I’ve come up against something I don’t yet understand.

I’m running identical code on my 10-core M1 MacBook Pro and on a large 128-core/128GB RAM cloud VM (a GCP n2d-highcpu-128), and it reliably finishes all the work around 3-3.5x slower (wall-clock time) on the cloud VM than on the Mac, seemingly using very little of the available CPU. Sounds like there’s got to be a limit somewhere but I can’t find it.

I’ve run heavily-loaded Erlang websocket servers on similar machines before and seen all CPUs at high utilisation just using mostly vanilla config, so I was expecting the Linux box to crush it effortlessly.

I realise it could be my code causing this, or triggering some difference that causes this, but the identical code behaves really differently on each platform and I don’t know where to look.

Some more info, and where I’ve looked so far:

  • I’m running a single supervised gen_server process which has a handle_call/3 function that spawns a specified number of plain non-OTP processes. Each process does a simple calculation in its startup function, writes a single result record into a duplicate_bag ETS table, and goes into a receive loop(). The ETS table has write_concurrency and read_concurrency both set to true. The table writes are working fine - I have some fetch specs which check the data after everything is done, and it’s all present and correct.

  • (I’ve tried doing it without the ETS writes; naturally that finishes much faster on both systems, but it’s still reliably more than 3x slower just to start the processes on the Linux VM than it is on the Macbook.)

  • The handle_call function just does spawn() inside a list comprehension with lists:seq(1,X) as the generator, and notes start and end times with erlang:monotonic_time(microseconds) before and after the comprehension. I realise this isn’t that realistic a scenario and there will be smarter ways to do this (this is just a POC), but regardless, it takes much longer to do the same spawn()s and writes on the VM than it does on the Mac:

    100k: 974ms Mac, 2772ms Linux (2.85x faster on Mac)
    500k: 4872ms Mac, 13836ms Linux (2.83x faster on Mac)
    750k: 7.2s Mac, 20.8s Linux (2.88x faster on Mac)
    1m: 10s Mac, 36s Linux (3.6x faster on Mac)
    1.5m: 14.4s Mac, 44.5s Linux (3.08x faster on Mac)
  • Those numbers seem to suggest there’s maybe also something that happens between 750k and 1m which makes the difference widen. I checked /proc/sys/kernel/threads-max which shows 1030974 so it can’t be that, otherwise (I think!) the Linux BEAM would bomb out with system_limit errors after ~1m.

  • Here’s the ulimit output:

    igor@cloud-vm:~$ ulimit -a
    real-time non-blocking time  (microseconds, -R) unlimited
    core file size              (blocks, -c) 0
    data seg size               (kbytes, -d) unlimited
    scheduling priority                 (-e) 0
    file size                   (blocks, -f) unlimited
    pending signals                     (-i) 515487
    max locked memory           (kbytes, -l) 16498290
    max memory size             (kbytes, -m) unlimited
    open files                          (-n) 1024
    pipe size                (512 bytes, -p) 8
    POSIX message queues         (bytes, -q) 819200
    real-time priority                  (-r) 0
    stack size                  (kbytes, -s) 8192
    cpu time                   (seconds, -t) unlimited
    max user processes                  (-u) 515487
    virtual memory              (kbytes, -v) unlimited
    file locks                          (-x) unlimited
  • I tried changing ulimit -u 2000000 but ulimit: max user processes: cannot modify limit: Operation not permitted, and when I did it all as root :grimacing: it changed the setting but the spawning/thread/core situation was the same. Same for ulimit -n open files (although I’m not doing anything in the filesystem, but unix).

  • The only custom BEAM configuration is ERL_FLAGS="+P 2000000" and the code is running inside rebar3 shell on both setups (Linux VM reports Erlang/OTP 25 [erts-13.0] [source] [64-bit] [smp:128:128] [ds:128:128:10] [async-threads:1] [jit:ns]). I’ve tried +K true just to be sure even though there’s no file or socket usage, and fiddled with +A and +S to no avail.

  • I’ve tried it in OTP 26.2.5 and 25.3.2.12 on my Mac, and I tried it in both 25.0.1/ESL and 27.0 on the VM (Debian 11, couldn’t find an R26 .deb, can try again if I can find a PPA or something for that). At first I thought it could be related to JIT improvements after R25, but then I got the same results on R27. (Also, R25 seems to do the work a bit faster than R26 on Mac(!).) I could put some of the difference down to running inside a VM, but these VM machines are used for native C++ apps distributed across all cores using GNU parallel, and their multi-core performance on those hits 100% per core and blows the Mac out of the water, as expected, so I don’t know.

  • I ran the code while watching vmstat 1 on the VM. It showed mostly idle CPU with interrupts and context switching going crazy while doing the spawning, and the same thing happening when sending a die message to all the processes (which causes them to just ok out of their loop()):

r  b   swpd   free   buff  cache   si   so    bi    bo   in   cs us sy id wa st
0  0      0 130103960  35472 754272    0    0     0     0  243  230  0  0 100  0  0
0  0      0 130104288  35472 754272    0    0     0     0  223  238  0  0 100  0  0
0  0      0 130104304  35472 754272    0    0     0     0  215  231  0  0 100  0  0
3  0      0 129778840  35472 754320    0    0     0     0 37213 64426  2  1 97  0  0 <- spawn()ing starts
5  0      0 129594880  35472 754320    0    0     0     0 45649 77408  2  1 97  0  0
4  0      0 129417056  35472 754320    0    0     0     0 45154 76444  3  1 97  0  0
5  0      0 129245264  35472 754320    0    0     0     0 45279 76551  3  1 96  0  0
5  0      0 129079640  35472 754320    0    0     0     0 44406 79255  3  1 96  0  0
5  0      0 128905848  35472 754320    0    0     0     0 42900 72504  2  1 97  0  0
5  0      0 128662480  35472 754320    0    0     0     0 43158 74755  3  1 96  0  0
4  0      0 128505176  35472 754320    0    0     0     0 43207 73535  2  1 97  0  0
8  0      0 128360384  35472 754320    0    0     0     0 42966 72490  2  1 97  0  0
[...]
3  0      0 125054408  35472 754776    0    0     0     0 44979 64148  2  1 97  0  0
0  0      0 125008624  35472 754880    0    0     0     0 23969 33793  1  1 98  0  0
0  0      0 125018416  35472 754880    0    0     0     0  473  453  0  0 100  0  0 <- spawn()ing finished
0  0      0 125018400  35472 754880    0    0     0     0  237  238  0  0 100  0  0
1  0      0 125018960  35472 754880    0    0     0     0  342  460  0  0 100  0  0
0  0      0 125019072  35472 754880    0    0     0     0  415  543  0  0 100  0  0
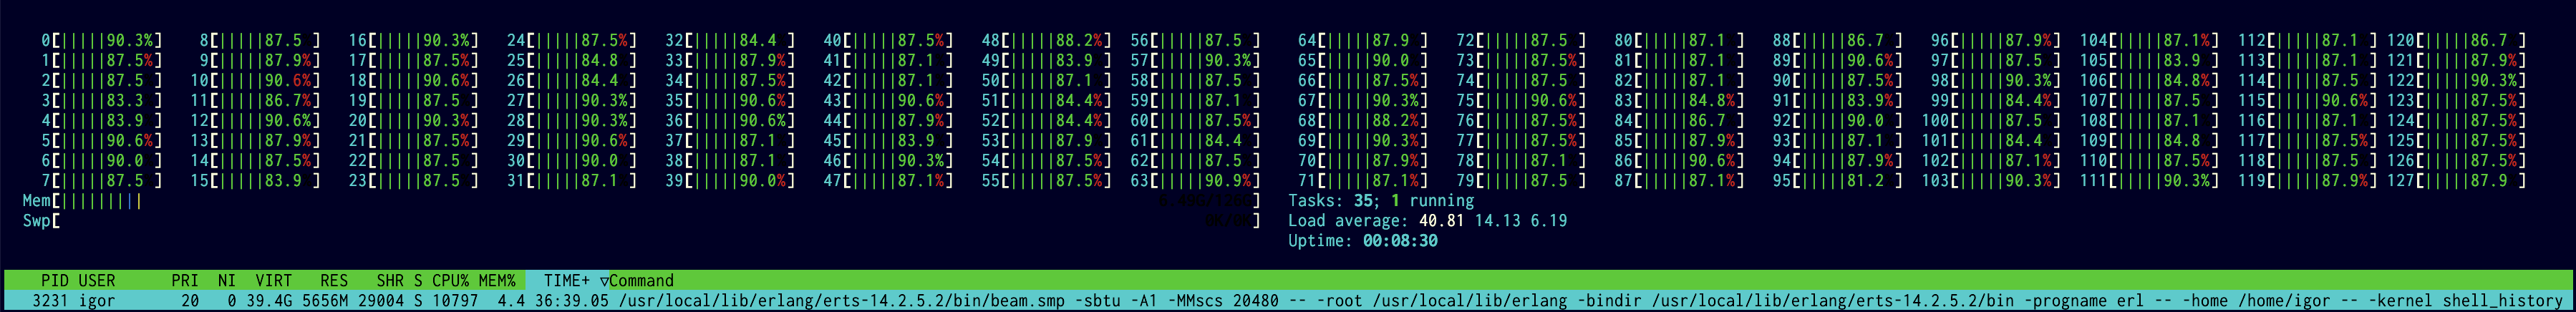
  • I also noticed while running htop during the spawn that there was much sparser green/red (user/sys) activity in the CPU-core grid than I’d expect, and much smaller load (1.62)/task (31) numbers:

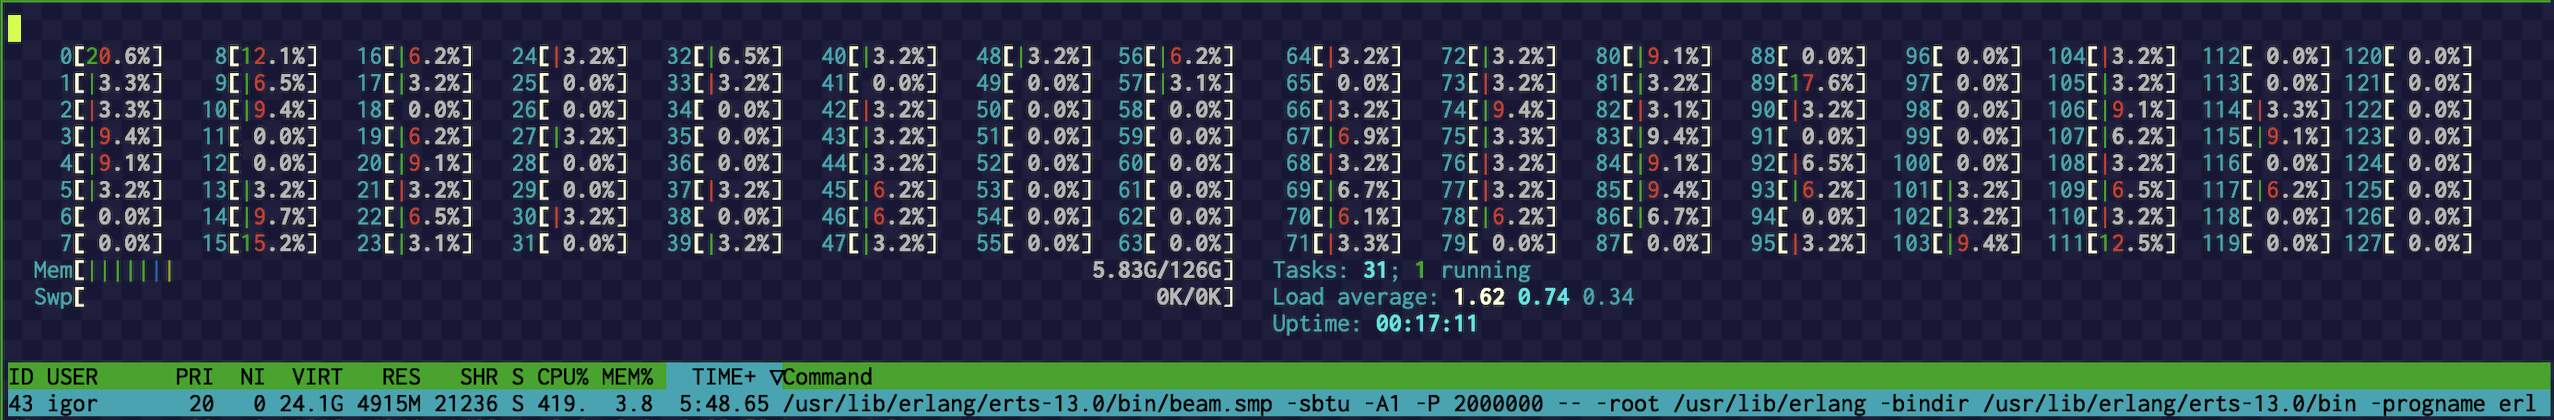
  • In fact the total CPU usage of the beam.smp process was only ever at maximum 450-500%. Again, these machines are often used to run many copies of single-threaded apps distributed across multiple cores, and I often see all cores running at 100% each, i.e. 12800% total utilisation. I realise that’s a different scenario, and the BEAM is a single process distributing work across multiple threads - but on the Mac it seems to just scale up automatically, I see all cores blazing for much shorter time, whereas on the Linux VM I see many idle cores and the work takes a lot longer overall.

So, lower than expected CPU utilisation on fewer cores than expected, plus high context switching, seems to suggest that the BEAM is doing way more work scheduling and allocating work to a smaller pool than it could be working with.

I must be either doing (/not doing) something in my code, or missing some Linux+Erlang config, that’s making that happen. I’m guessing it’s something to do with process/thread management/distribution, but I don’t know what else to look at to try and change or tune.

Any tips would be very welcome, thanks!

4 Likes

Gentle bump here, could use a bit of help, still seeing the same issue :neutral_face:

I’ve worked up a prototype program doing things more naturally, it spins up a specified number of worker processes (I’m using between 1000-5000 for testing), and a controller process which sends them all work commands via syn:publish/3. They report back and when they’re all done it sends the next command.

It works really well on MacOS, runs really smoothly and hovers around 950-980% CPU usage on my 10-core M1, but on the big Linux VM it uses about 600-800% CPU out of a possible 12800%. vmstat shows interrupts and context switching like crazy, and the program progress is like molasses compared to the identical code on the Mac. I thought it might be swap-thrashing but it’s not even that, there’s barely a few GB used by beam.smp (or anything else) out of 128GB on the box:

               total        used        free      shared  buff/cache   available
Mem:           125Gi       3.8Gi       121Gi        13Mi       489Mi       121Gi
Swap:             0B          0B          0B
procs -----------memory---------- ---swap-- -----io---- -system-- ------cpu-----
 r  b   swpd   free   buff  cache   si   so    bi    bo   in   cs us sy id wa st
 5  0      0 127642928  26824 474660    0    0     0     0 195146 283966  4  2 94  0  0
17  0      0 127612192  26824 474664    0    0     0     0 260204 257411  7  3 90  0  0
13  0      0 127485304  26824 474664    0    0     0     0 194401 287274  4  2 93  0  0

Other CPU-bound apps still show full CPU utilisation when running, all cores blazing, so the machine is working properly. I’ve fiddled with sbt options but that hasn’t made any difference.

Any ideas about what might be needed to tune the BEAM configuration here, or perhaps how to code differently to deal with Linux’s different scheduling? Setting aside my fruitless tweaking the config’s pretty much as it comes out of the box, using rebar3’s default sys.config and vm.args. Same as on the Mac.

Thanks!

(Edit: Just built 26.2.5.2 from source on the Linux box and tried it out, exactly the same result.)

1 Like

Have you checked how many CPU cores that the Erlang runtime will actually use?

It can checked by looking at the first line printed when erl is started, or by calling erlang:system_info(schedulers_online). Here is how it looks on my Mac (8 cores):

Erlang/OTP 27 [erts-15.0] [source] [64-bit] [smp:8:8] [ds:8:8:10] [async-threads:1] [jit]

Eshell V15.0 (press Ctrl+G to abort, type help(). for help)
1> erlang:system_info(schedulers_online).
8

What is the number in your cloud VM?

2 Likes

Thanks @bjorng! Yes I have, when I checked the 25.0.1/ESL build for the first post it reported this:

Erlang/OTP 25 [erts-13.0] [source] [64-bit] [smp:128:128] [ds:128:128:10] [async-threads:1] [jit:ns]

and now I’m running the source-built 26.2.5.2 I get this:

Erlang/OTP 26 [erts-14.2.5.2] [source] [64-bit] [smp:128:128] [ds:128:128:10] [async-threads:1] [jit:ns]

and

1> erlang:system_info(schedulers_online).
128

Which is pretty baffling!

2 Likes

I now see that you did provide that information in your first post. I missed that.

I’ve discussed this with some OTP team members and we came up with a few suggestions to find out more about what is happening.

First you could try to limit the number of cores the Erlang node uses. If that improves performance, that could indicate lock contention. For example, try using 8 cores and then 16 cores and compare with the performance to your Mac. Here is how to limit the number of cores:

% erl +S 4
Erlang/OTP 27 [erts-15.0] [source] [64-bit] [smp:4:4] [ds:4:4:10] [async-threads:1] [jit]

Eshell V15.0 (press Ctrl+G to abort, type help(). for help)
1> 

Another way is to use the lcnt module to profile locks. Here is the documentation:

https://www.erlang.org/doc/apps/tools/lcnt_chapter.html

3 Likes

Hey thanks a lot @bjorng! I tried this with a variety of core counts and got the following results - it’s a fixed set of work to be done by 1000 processes, which finishes within a given time, thus:

128 cores  157137.559ms

 10 cores  120674.968ms
 16 cores   92406.832ms
 32 cores   85636.319ms
 36 cores   88699.502ms
 40 cores   91277.482ms
 48 cores  102513.529ms

As the time goes down so do the numbers of interrupts and context switches and up goes the CPU utilisation across the cores in use. I didn’t let the 4-core version finish, it was obviously using 100% of the 4 cores but it was really slow, so I jumped to 10 to match the Mac. That improved things, about 25% faster than with 128 cores active, so I tried the other core counts.

There seems to be a sweet-ish spot at 32 cores (that’s still 14 seconds slower than my 10-core M1, I guess the VM cores are slower, they’re “2nd Gen AMD EPYC” but it’s hard to get a clock speed from GCP info) - up until then the performance improves but after that it seems to drop off again.

Worth noting that at 16 cores it was showing high 90s %CPU for each core in use; 32 was down to 50-ish, but more of them working, and the overall time taken was lower; 48, higher again, probably 70-75%-ish average, but many more CS and IN happening again and over time taken higher again.

I’ll read up on the profiling, thanks for the link - it looks like there’s a bit to get my head round in order to understand the results once I’ve instrumented the code. Are there any obvious things that my code might be doing to cause this?

1 Like

This is a very interesting read! Let me preface this by saying I have no idea what I’m talking about as I’m only in this for a good time! So you’ve been warned :smiley:

For starters let’s talk hardware for a bit, because it’s super fun.

The chip you are running looking at the docs is a EPYC 7B12. Which has 64 physical not 128 cores. SMT aka Hyper threading makes it look like 128 logical cores, but physically it’s 64.

Next, let’s look at that M1pro chip - it’s 10 cores. And that’s 10 actual cores. Apple does not do SMT so when you see 10 that’s what you get. However, it’s 8 high performance cores and 2 efficiency cores. Ok let’s see how they stack up?!

https://www.cpubenchmark.net/compare/4580vs4398/Apple-M1-Pro-10-Core-3200-MHz-vs-AMD-EPYC-7B12

Looking at the overall work being done the 64 core machine does 3x the overall work the M1 chip does. 3x is a lot but I actually expected it to be much more. But looking at the single core performance a single M1 core is 2x as fast! Whoa crazy.

I’m VERY curious if we ran some benchmarks on both machine using some different benchmarking programs to see what numbers you get. There’s some interesting information here:

I’ve seen lots of talk about disabling SMT in games but not so much in linux workload benchmarks. I’ve not tried disabling SMT for my own benchmarks, but maybe I should try? I would definitely try this to see how it affects your benchmarking. Would doing that affect scheduler affinity settings differently? Also I know very little about Linux OS scheduler settings but might also be something to investigate. I also wonder if the posted benchmark tracks if you run your program with a single scheduler on both platforms?

I might be way off track here but just some ideas I had that you might want to try out.

2 Likes

If you post the results in this thread we can help you interpret the results.

3 Likes

Thanks a lot @bjorng, it might take me a little time to get this done but I’ll definitely post the results back here when I have. Appreciate the help!

@gregors that’s interesting, thanks - I think the M1s are nuts fast, and the difference between 8 and 10 was very small which stacks up with perf vs efficiency cores. I can try looking at some single core benchmarking at some point but again that’ll take a while - thing is it’s not so much the final time taken I’m concerned about, it’s that the cores are ~100% utilised on the Mac and they’re hardly used on the Linux. Am I missing your point?

1 Like

@igorclark my main point was M1 doesn’t use SMT but AMD does. Could that cause issues?

I was reading through this and it has some interesting examples (it’s old from 2011 - so I don’t know if it still pertains to modern BEAM)

Characterizing the Scalability of Erlang VM on Many-core Processors

2 Likes

Ah OK, got you, thanks! Well I don’t know whether that could cause issues. The only other comparably large VM I’ve run Erlang apps on was a 96-core AWS box serving a large number of websocket connections a couple of years ago, and I remember clearly being impressed by how the CPU utilisation scaled absolutely linearly under load, even though I didn’t do anything special in the code. I’m guessing that it did have SMT, as AWS seem likely to want to get as many “virtual cores” out of their physical hosts as they can, but I don’t know for sure as I can’t find the instance type we used in the terraform docs. It’s an interesting question though, I wonder if it’s related to what’s goine on. I guess more impetus for me to do the lcnt instrumentation to try and find out :grimacing:

1 Like

Along these lines - I know it was often standard practice in Postgres servers to disable hyperthreading to improve performance. Don’t know if that’s still the case but might be something worth trying for the BEAM as well. My long time ago experience was that the BEAM scaled near linearly at about 80% efficiency but don’t recall how many cores we got up to. Probably 32 or 64.

– Ben Scherrey

Interesting, thanks! Well I went to the GCP console in the hope this might be quick fix, and found the setting “vCPUs to core ratio”, with a tool-tip saying “select a custom simultaneous multithreading ratio for GCE cores”.

It was set to “none” by default, which showed the machine type as n2d-highcpu-128 (128 vCPU, 64 core, 128GB). So I changed it to “1 vCPU per core”, which changed the machine type to n2d-highcpu-128 (64 vCPU, 64 core, 128GB). Rebooted and it only showed 64 cores in htop and /proc/cpuinfo.

Tried the same task again, and this time the CPU utilisation hovered around 40-45% on all 64 cores, and took 123987.220ms. That’s faster than the 157137.559ms that it took on “128” before, but still broadly in line with the runs I did with restricted core counts, jumping up from 157137.559ms at 48 (with SMT) to 123987.220ms at 64 (without SMT), and still with a very high number of interrupts and context switches (~150k-200k).

procs -----------memory---------- ---swap-- -----io---- -system-- ------cpu-----
 r  b   swpd   free   buff  cache   si   so    bi    bo   in   cs us sy id wa st
 8  0      0 128402752  29716 367828    0    0     0     0 238652 190786 22  5 74  0  0
 2  0      0 128406512  29716 367828    0    0     0     0 270593 217760 13  6 81  0  0
66  0      0 128578272  29716 367828    0    0     0     0 156387 208993 20  4 76  0  0
 5  0      0 128366280  29716 367828    0    0     0     0 146992 180169 27  4 69  0  0
 8  0      0 128423712  29716 367828    0    0     0     0 152534 225028 13  4 83  0  0
36  0      0 128552800  29716 367828    0    0     0     0 157005 206953 21  4 75  0  0
17  0      0 128372704  29724 367828    0    0     0    16 156409 186168 26  4 70  0  0

Interestingly the idle % has dropped to about 75 avg. I’m not too sure what to make of that. It seems like it did broadly the same amount of work, reported differently in terms of utilisation, but in basically the same time ballpark.

I’ll have to make time to instrument with lcnt!

2 Likes

Quite interesting topic to me as we are also running an Erlang application on 64 core VMs that is CPU intensive.

High interrupt and context switches are also what we observed which seem to limit the amount of ‘user’ CPU that can be utilized, thus no linear processing time reduction as the number of Erlang schedulers are increased.

Tried lots of beam tuning option. The only one that has significant affect is the super-carrier option: MMscs. Setting it large enough reduced the amount of interrupt and context switches, reduced number of page faults reported by pidstats and reduce the amount of ‘sys’ cpu usage. In htop, we are able to observe all cores hitting 100%.

Maybe you want to give it a try.

16 Likes

Hello @PM-Young,

Thanks so much for replying, especially as you only just joined the forum - and thanks, that absolutely worked!

With 10GB super-carrier pre-allocated, the task that previously took 102513.529ms on 48 cores, and didn’t hit anything like full CPU utilisation, now took 55305.556ms on 64 cores without any special +S setting, through hitting ~90% utilisation.

When using 20GB it took 34331.071ms(!) and showed this in htop:

and vmstat 1 looked like this:

procs -----------memory---------- ---swap-- -----io---- -system-- ------cpu-----
 r  b   swpd   free   buff  cache   si   so    bi    bo   in   cs us sy id wa st
67  0      0 125761360  30296 371872    0    0     0     4 65004 34775 94  1  5  0  0
65  0      0 125760168  30304 371872    0    0     0    12 76262 46523 93  1  6  0  0
67  0      0 125764800  30304 371872    0    0     0     0 47517 42297 94  1  5  0  0
67  0      0 125719088  30304 371872    0    0     0     0 37392 40410 94  1  5  0  0

So that’s almost an order of magnitude reduction in interrupts and context switches (cs dropped from 200-250k down to 34-45k), a huge leap in CPU utilisation to what I had expected, and overall a huge drop in time taken to complete the work. Superb.

NB those measurements were all with SMT switched off, so only 64 cores visible. With SMT switched on, there was a further improvement, not another halving/doubling, but even though cs/in jumped back up to 70-100k, and the per-CPU utilisation dropped a bit as well, the overall time taken dropped down to 26331.051ms! So it seems SMT is definitely part of the story:

(Pushing +MMscs further up to 40960 didn’t make any noticeable difference, so it seems like as per the manual, it’s about making sure there’s enough pre-allocated to cover all the app’s usage, so that all allocations are done inside the existing slab.)

Thanks so much for the info, this is super exciting. (Especially as I’ve been having trouble getting lcnt to compile on Mac for comparison - the main point was to run it on Linux but I haven’t got to that yet either, still plan to look at it.) Also I learned about pidstat(1), thanks for that too.

What a great start to the day, nice one :+1:

11 Likes

So glad that you are able to get much better performance with super carrier setting! it is a great feeling seeing all cores finally goes to almost 100% green in htop :slight_smile: Your experiment on SMT is also quite interesting, the performance gain is larger than what I would expect. We usually run the workload at half of the vCPU or SMT cores count.

Before super carrier was released, we tried many different memory allocator strategies, settings and compiled beam.smp with huge page enabled, none really helped much.

One other setting that worked somewhat for us is sbwt and sbwtdcpu = none. This is a bit anti-intuitive, but probably more because our workload is more batch oriented without realtime/concurrent latency need. IIRC, this setting gave around 15% improvement.

As a side note, on bare metal servers or workstations, we found that the cpu pinning or scheduler binding (sbt) can also effectively reduce IN/CS and hence much better performance. However, the effect is somewhat lost when running on VMs or GCP, perhaps due to VM configuration or hypervisor scheduler support.

3 Likes

Thanks a lot Philip, that’s all really interesting and very useful. My potential application doesn’t need real-time results either, hence it’s OK to wait for the CPU to finish what it’s doing but obviously don’t want to wait longer than need be. Remaining responsive to control commands while doing the work is pretty key though.

If this project gets green-lit then I’ll definitely be looking into these a lot more deeply. The improvements with the super carrier and the SMT have already been plenty to give me confidence it’s viable - now for the funding & organisational stuff! :grimacing:

Thanks again :+1: