Hi guys,
I’m looking for a library (and/or a Docker image) which will let me send my Erlang VM metrics (memory, scheduler utilization, number of processes, etc.) to Prometheus/Grafana?
Thanks.
Hi guys,
I’m looking for a library (and/or a Docker image) which will let me send my Erlang VM metrics (memory, scheduler utilization, number of processes, etc.) to Prometheus/Grafana?
Thanks.
Questions:
Are you already instrumenting your application with telemetry or open_telemetry ?
What VM metrics are you interested in exactly? telemetry_poller ships with some basic VM metrics.
GitHub - deadtrickster/prometheus.erl: Prometheus.io client in Erlang is another alternative.
As a side note, you can also send statistics related to Erlang process and applications to Grafana with this application: GitHub - ieQu1/system_monitor: "htop" for erlang / elixir processes
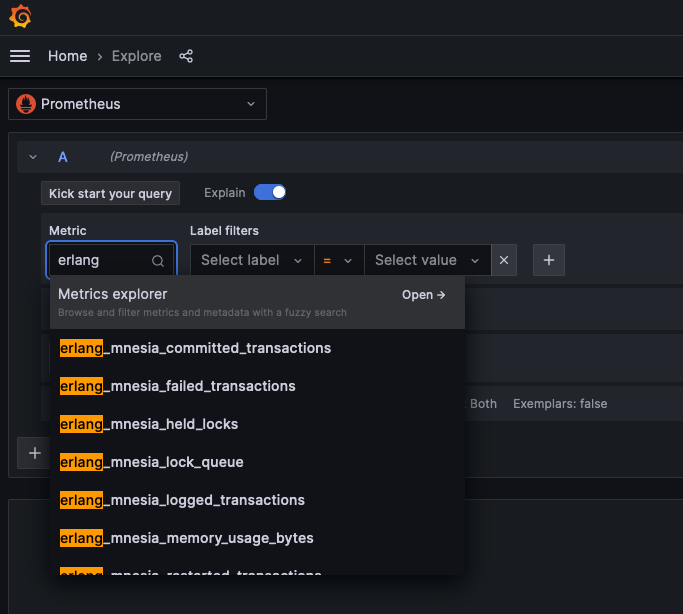
@rfk23 @deadtrickster I’ve managed to integrate prometheus.erl with my service and export the VM metrics via cowboy.
Prometheus is able to consume these metrics (see attached screenshot).
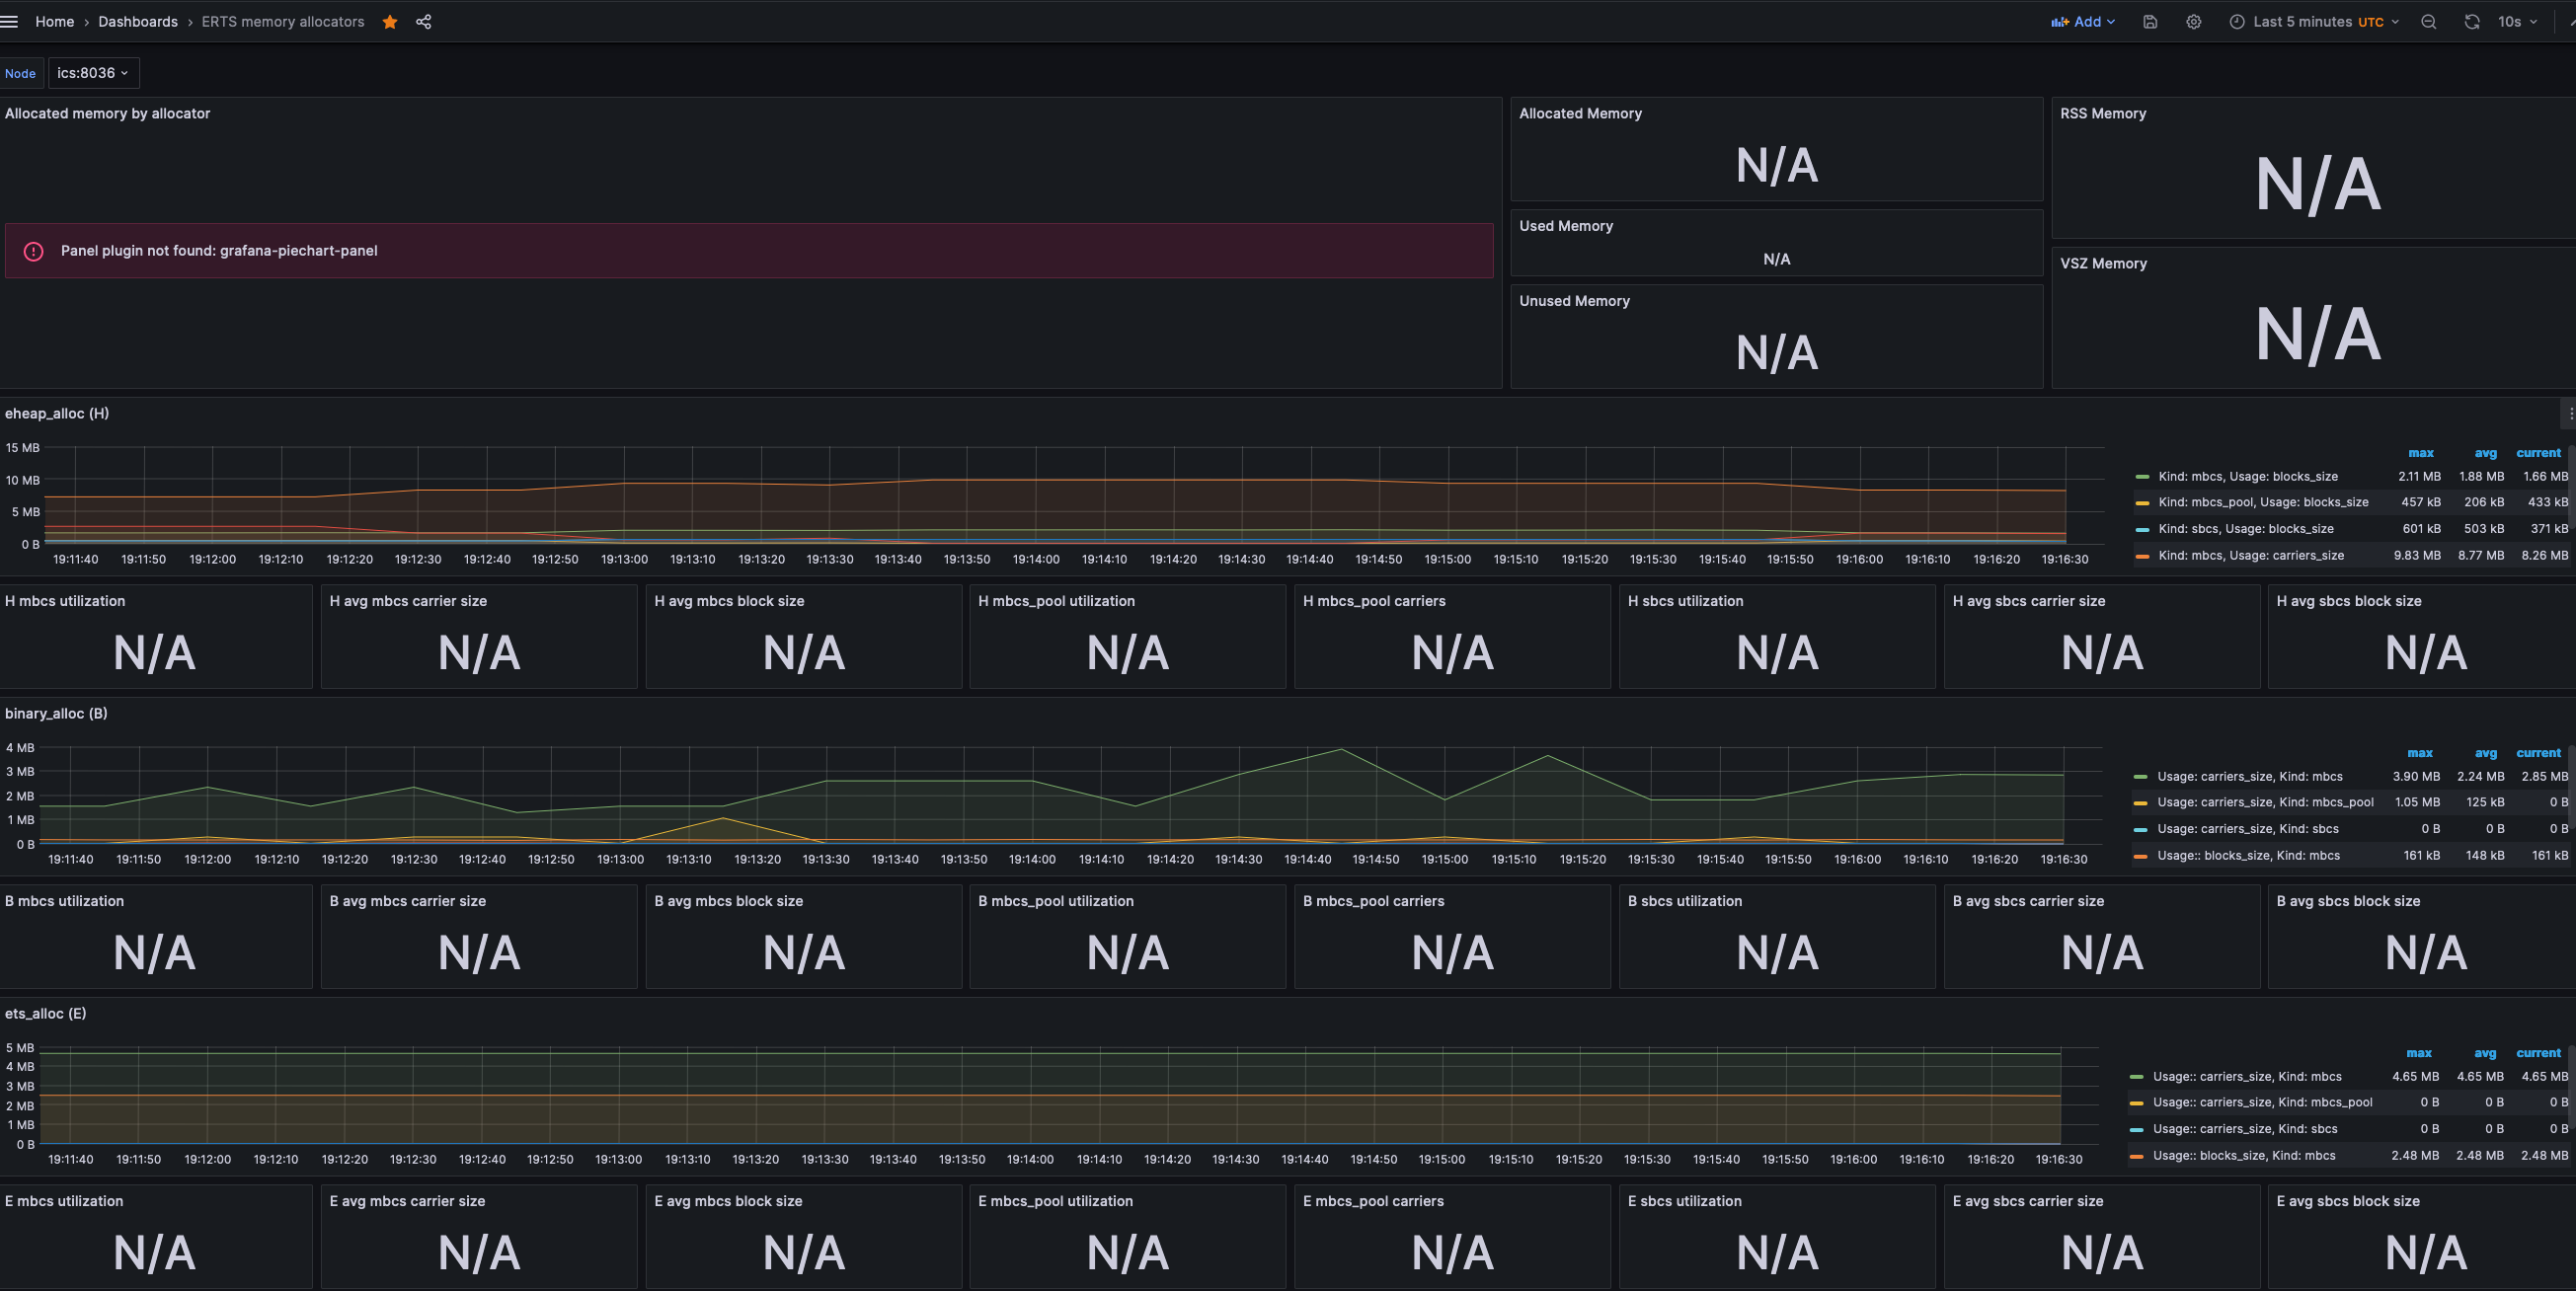
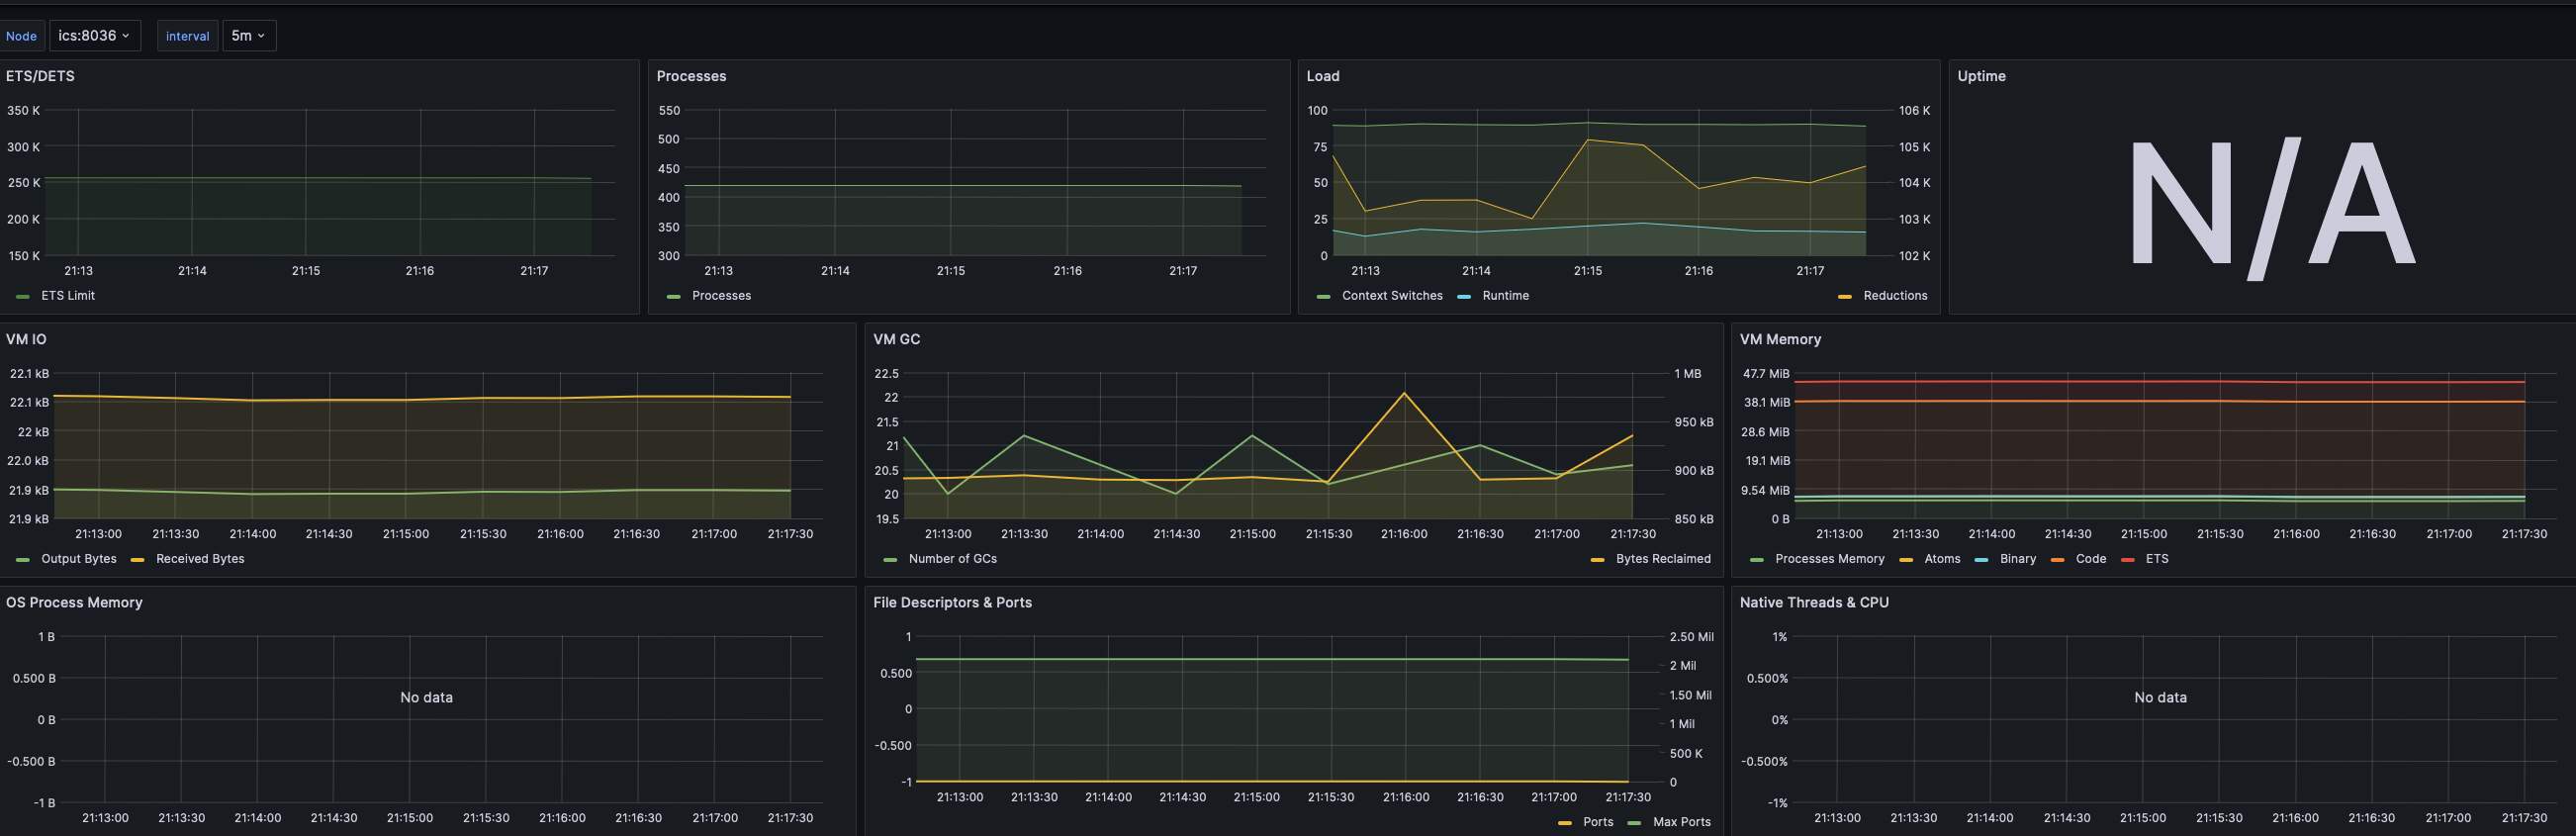
Now my issue is to find a Grafana dashboard to display them:
I tried a RabbitMQ dashboard, but unfortunately no metric was displayed.
Help appreciated.
Am I the only one trying to use prometheus.erl with Grafana :-/ ?
Not sure, but if you’re seeing metrics but the dashboards are not working then it probably means your metric names are not aligned with what the dashboard is setup to work with query wise.
The metric names are correct IMHO. But the BEAM Grafana dashboards are old (no update for +5 years).
Maybe Erlangers are simply not using prometheus.erl/Grafana to display VM’s metrics.
If this is the case, what are you using guys? Thanks
What I mean, and to get clarification you went to edit mode on one of the panels and found that the metric names you’re emitting are the some ones the panel is trying query on?
As an example, sum(erlang_vm_allocators{kind=\"mbcs\",alloc=\"eheap_alloc\",usage=\"blocks_size\", instance=~\"$node\"}) / sum(erlang_vm_allocators{kind=\"mbcs\",alloc=\"eheap_alloc\",usage=\"carriers_size\", instance=~\"$node\"}) That query looks just fine, but there’s some expectations in there, the name of the metric and tags aside, it’s also expecting there to be a node variable.
Not to say none of it’s old, but it doesn’t look broken either, at a glance anyway.
FWIW, we should all be moving to open_telemetry ![]()
We’re using Cowboy + Prometheus.erl to export metrics to Prometheus/Grafana. I’ve adapted the BEAM dashboards to our needs in our internal environment, but it was a lot of work.
Does this have any support for metrics / Prometheus exporting out of the box? I haven’t been able to figure out just by reading the documentation…
@eproxus would it be possible to share these modified Dashbords (only the VM’s metrics, not the ones you made for your company)?
Yes, with otel_collector, see here : Erlang/Elixir | OpenTelemetry
Note that metrics and logs are still considered experimental, but that’s where we have to step up and start using these things so we can go back to the EEF observability working group with feedback ![]()
Also note, and this an IMHO, I would advise not to use prometheus directly and use mimir as an example (assuming you have a grafana setup).
I’ve also had my eye on honeycomb because high cardinality metrics are thing we all need ![]()
Edit:
Calling on @tsloughter to keep me honest here.
Prometheus support is in a draft PR Add prometheus exporter by albertored · Pull Request #619 · open-telemetry/opentelemetry-erlang · GitHub
But yes, going to the collector with the Otel protocol (and then export as prometheus from the collector) works as well.
And yes, need beta testers :).
We (RabbitMQ team) have two dashboards with some of the Erlang metrics. They would certainly benefit from some updates as well, but perhaps you’ll find them useful.
Thanks @kura I tried them both, but none worked out-of-the box with prometheus.erl due their dependency to rabbitmq-prometheus plugin.
I’m afraid they are too internally adapted (to hostnames/patterns, internal server queries etc.) to share ![]()