On OTP 23 our performance tests for our project were passing with a small percentage of slowdown - 7 out cases which was working slowly on 10K iterations.
But after move on OTP 26.0.2 our performance tests are slowed down - 296 out cases which was working slowly on 10K iterations.
I tried find to the reason and I didn’t catch what’s wrong. Our code wasn’t changes - only OTP version was.
And we see the slowdown probabilistically.
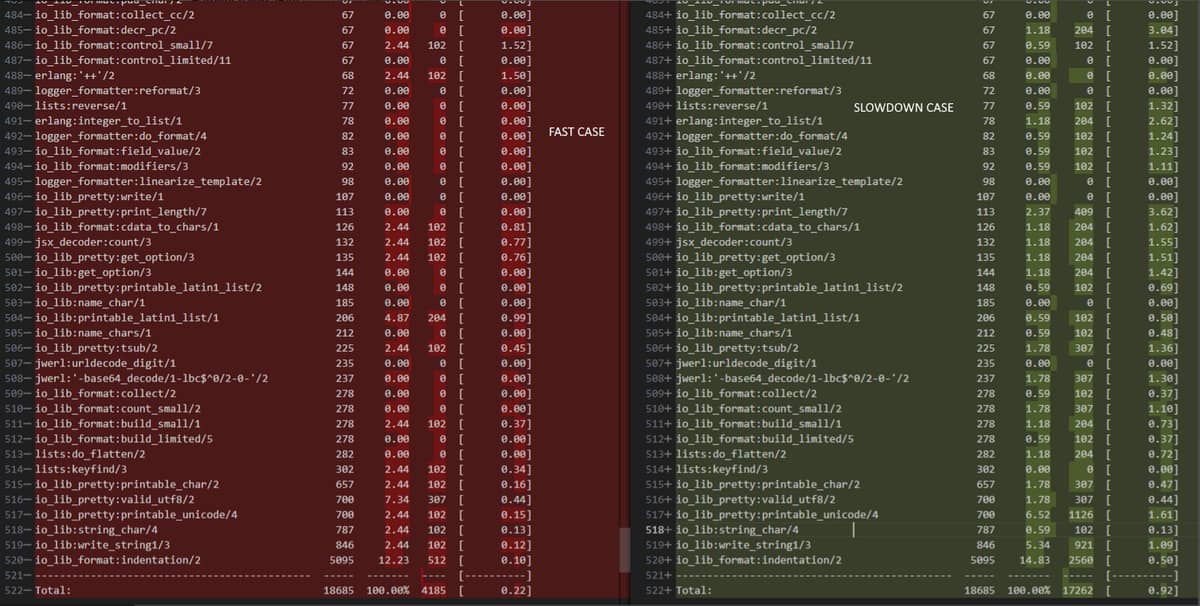
We used eprof to calc. data for our “slow” function, and have the result (the result with turned on logger):
As you can see, most of the functions have slowed down, not a few
Maybe somebody know what happened between 24 - 26 Erlang which started to work slower?
Maybe some changes in ERTS? There may have been changes in the work of the scheduler or GC?
I would note that eprof may not be the best tool for micro-benchmarking, or figuring out the cause of a slowdown. And having said that, I would recommend Linux perf to profile code running with OTP 26. It may give a clue where the bottleneck is.
Yea, you are right and I have no idea where to look (
I think that information might terribly helpful.
Of course, sorry for that I didn’t say more. We use VMWare virtual machine with Debian 10 on x64 arch.
How exactly how the performance tests run?
We have one RPC request to the service through RabbitMQ. That request will be processed with some work and will be saved in cache (Mnesia).
After that we are remember time to handle request and then we send 10K RPC requests one by one (without sleep) and see time to handle request.
Sometimes requests from cache work slowly then requests without cache. And mechanism with cache work with stable time,
but the code around this began to slow down.
Before call the cache service parse ETF-request (type map()) to terms and will call cache,
then serialize term to ETF (type map()).
It all happen working in one erlang-process, which handling RabbitMQ message.
I think it’s still not enough information for assessing the situation…
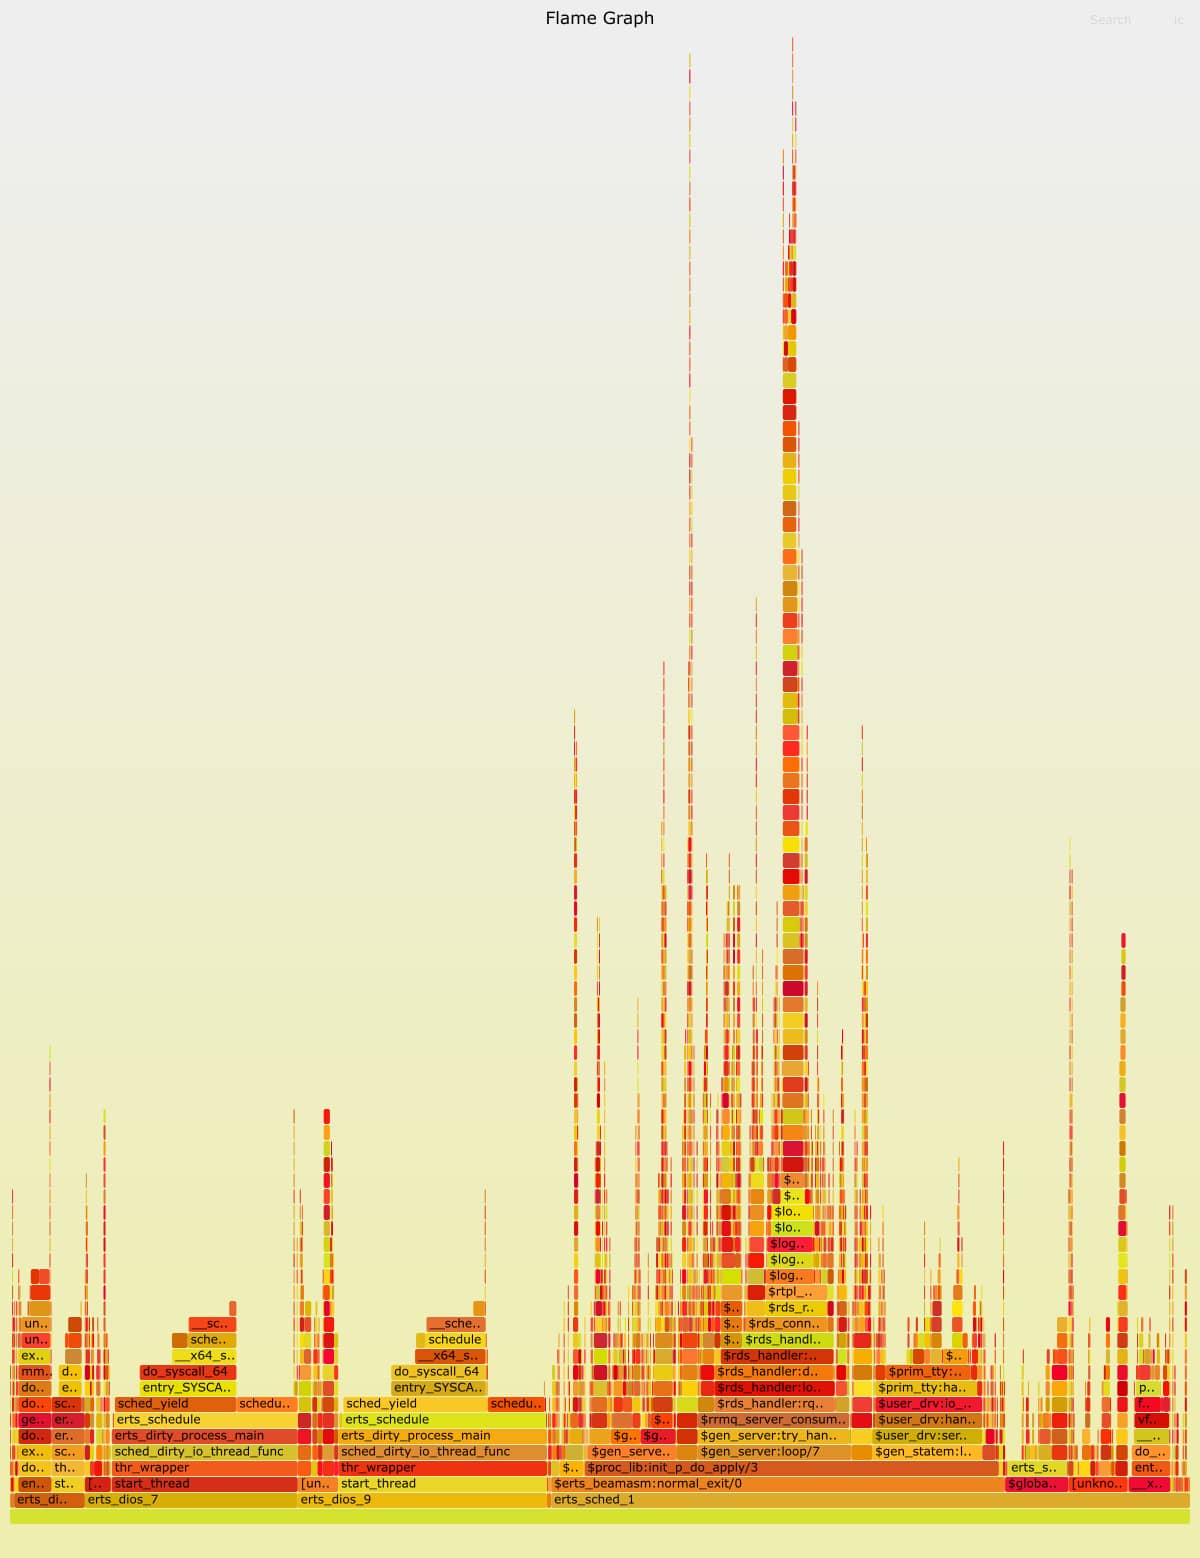
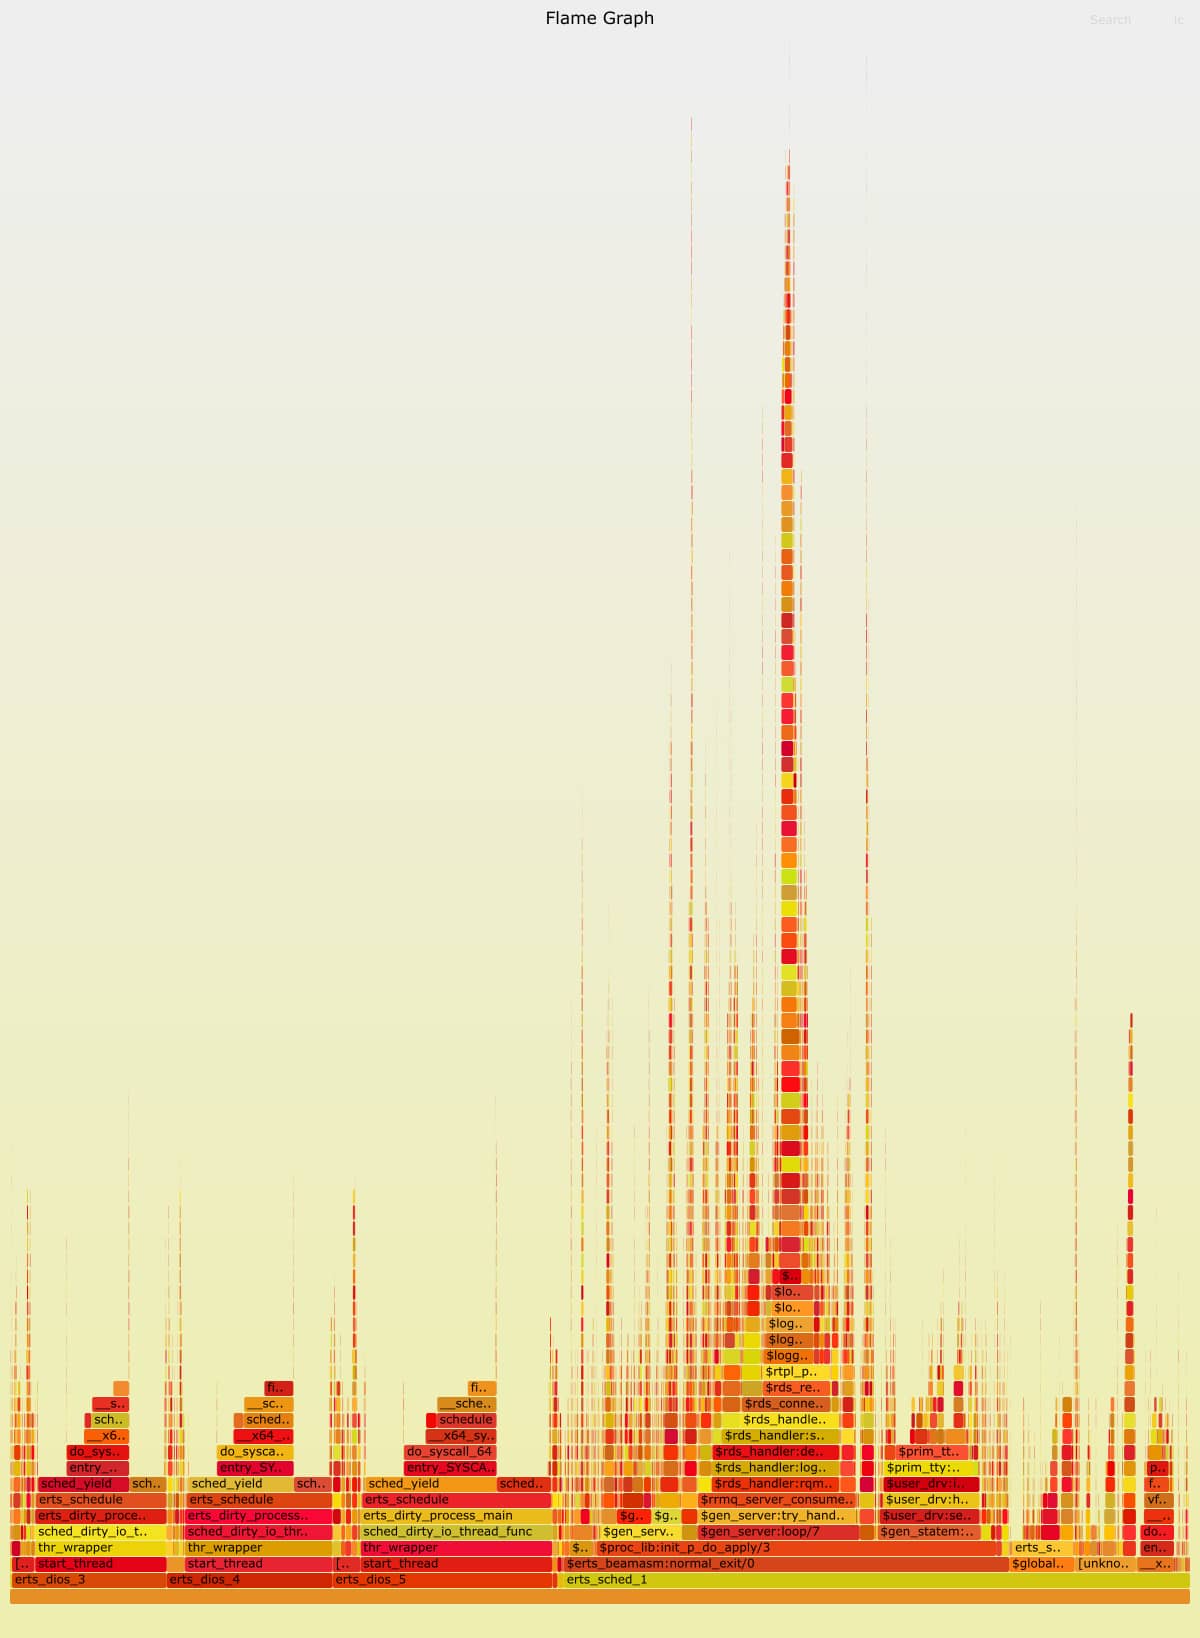
The two images appear identical. Anyway, how did you create these graphs? The way I usually do that, I run the benchmark in an endless loop, and use perf -g -p 'pidof beam.frmptr.smp' to capture only a small portion of the actual test run.
You’re right that (small) PNG pics aren’t helpful for debugging purposes, so the better way to share (things like *.svg files) could be uploading it somewhere (gist?) and providing a link to it.
I think the question for me still is : Are you sure anything is actually going slower?
I had a recent case where with one benchmark tool, term_to_binary/1 came out faster than term_to_iovec/1, which is not the expectation. In another benchmark tool, term_to_iovec/1 came out faster, as expected.
Do you have any reason to believe other than what eprof and such shows that anything is slower? Maybe it’s worth checking request time, etc. What do you think?