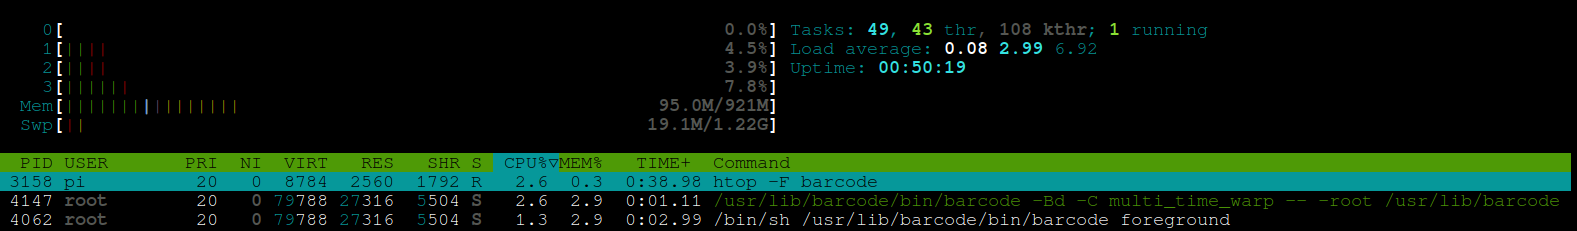
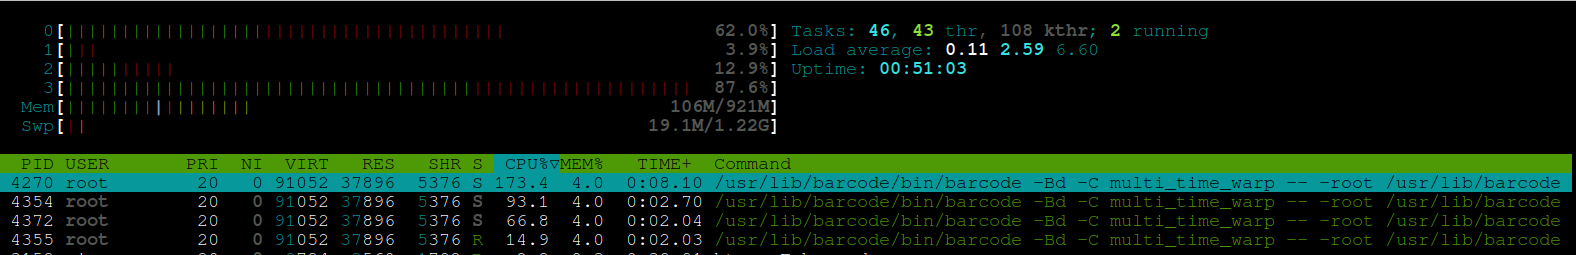
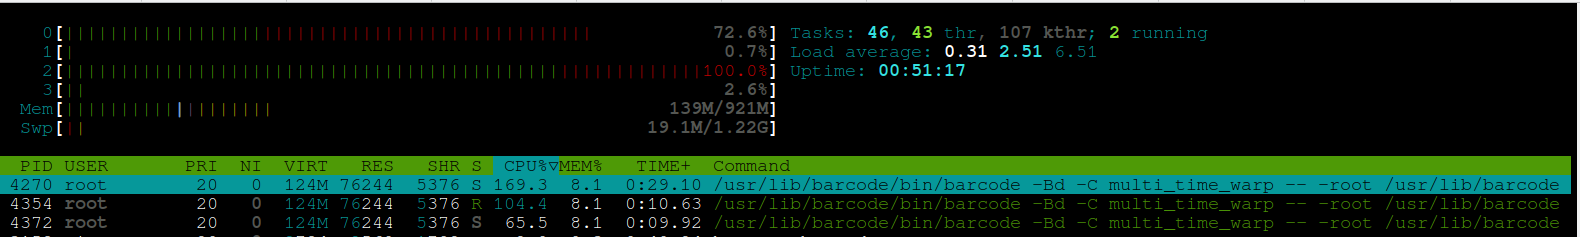
I arrive slightly confused. My application is eating up all available memory. I tried to look through observer or recon and I don’t see anything. The application does not consume memory, but htop shows that the beam processes are using up all memory and the swap file
recon_alloc:memory(allocated_types).
[{binary_alloc,425984},
 {driver_alloc,163840},
 {eheap_alloc,3014656},
 {ets_alloc,393216},
 {fix_alloc,425984},
 {ll_alloc,23592960},
 {sl_alloc,425984},
 {std_alloc,688128},
 {temp_alloc,655360}]
recon:node_stats_print(1, 100).
{[{process_count,100},
  {run_queue,2},
  {memory_total,18943352},
  {memory_procs,2637052},
  {memory_atoms,417173},
  {memory_bin,13408},
  {memory_ets,376320}],
 [{bytes_in,8994},
  {bytes_out,0},
  {gc_count,12},
  {gc_words_reclaimed,27756},
  {reductions,61445643},
  {scheduler_usage,[{1,0.6438721760242981},
                    {2,0.002663861349804496},
                    {3,0.0035298204128896508},
                    {4,0.0058989101171309614},
                    {5,0.0},
                    {6,0.0},
                    {7,0.0},
                    {8,0.0}]}]}
erl -version
Erlang (SMP,ASYNC_THREADS) (BEAM) emulator version 13.2.2.6

Erlang/OTP 25 [erts-13.2.2.6] [source] [32-bit] [smp:4:4] [ds:4:4:10] [async-threads:1]
which way to look?