We observed some undesirable performance of Erlang BEAM on some specific AWS instances, and not on others. The poorly performing instance types are c7i.24xlarge and c7i.metal-48xl. On these systems (perhaps the same underlying hardware?), and with the default number of schedulers online (96 and 192 respectively), a workload that does heavy message-passing between Erlang processes is untenable.
We observed this on our production workload and created a benchmark that reproduces the problem. In this post we’ll compare the performance across some different instance types. We’re seeking help on where to go next.
System info:
All systems under test have 96 logical processors, except for c7i.metal-48xl, which has 192.
Linux hostname 5.15.0-1084-aws #91~20.04.1-Ubuntu SMP Fri May 2 06:59:36 UTC 2025 x86_64 x86_64 x86_64 GNU/Linux
Erlang info:
Erlang/OTP 28 [erts-16.0] [source] [64-bit] [smp:96:96] [ds:96:96:10] [async-threads:1] [jit:ns]
The same for all systems, except for c7i.metal-48xl, which had 192 schedulers online.
Poorly performing AWS Instance Types under test:
- c7i.24xlarge
- c7i.metal-48xl
Highly performing AWS Instance Types under test:
- m5.24xlarge
- c7i.metal-24xl
Benchmark
Repo: message_load_benchmark_public
The benchmark is simple. First it starts a set of Erlang processes, all with an equivalent event loop. Each process randomly selects a target process and sends a message. It then inspects its message queue for any messages that are currently queued and flushes them. Finally, it waits at most 10 ms for the receipt of a new message. When such a message is received, the time difference is calculated between the send and the receive. Then, the process loops.
Our intention is to approximate the real amount of time between the sender and the receiver, without including message queue time. Any flushed message is not included in the throughput or latency metrics.
The benchmark is not expected to be a saturating workload for these systems. We only start a modest number of Erlang processes.
Metrics to compare across instance types:
- Throughput (msg/sec): The rate of messages measured at the receivers. Higher is better.
- Latency (usec): Average number of microseconds measured between the send and the receive for good throughput only. Lower is better.
- Flushput (msg/sec): The rate of messages that have been discarded from measurement due to queueing. Lower is better.
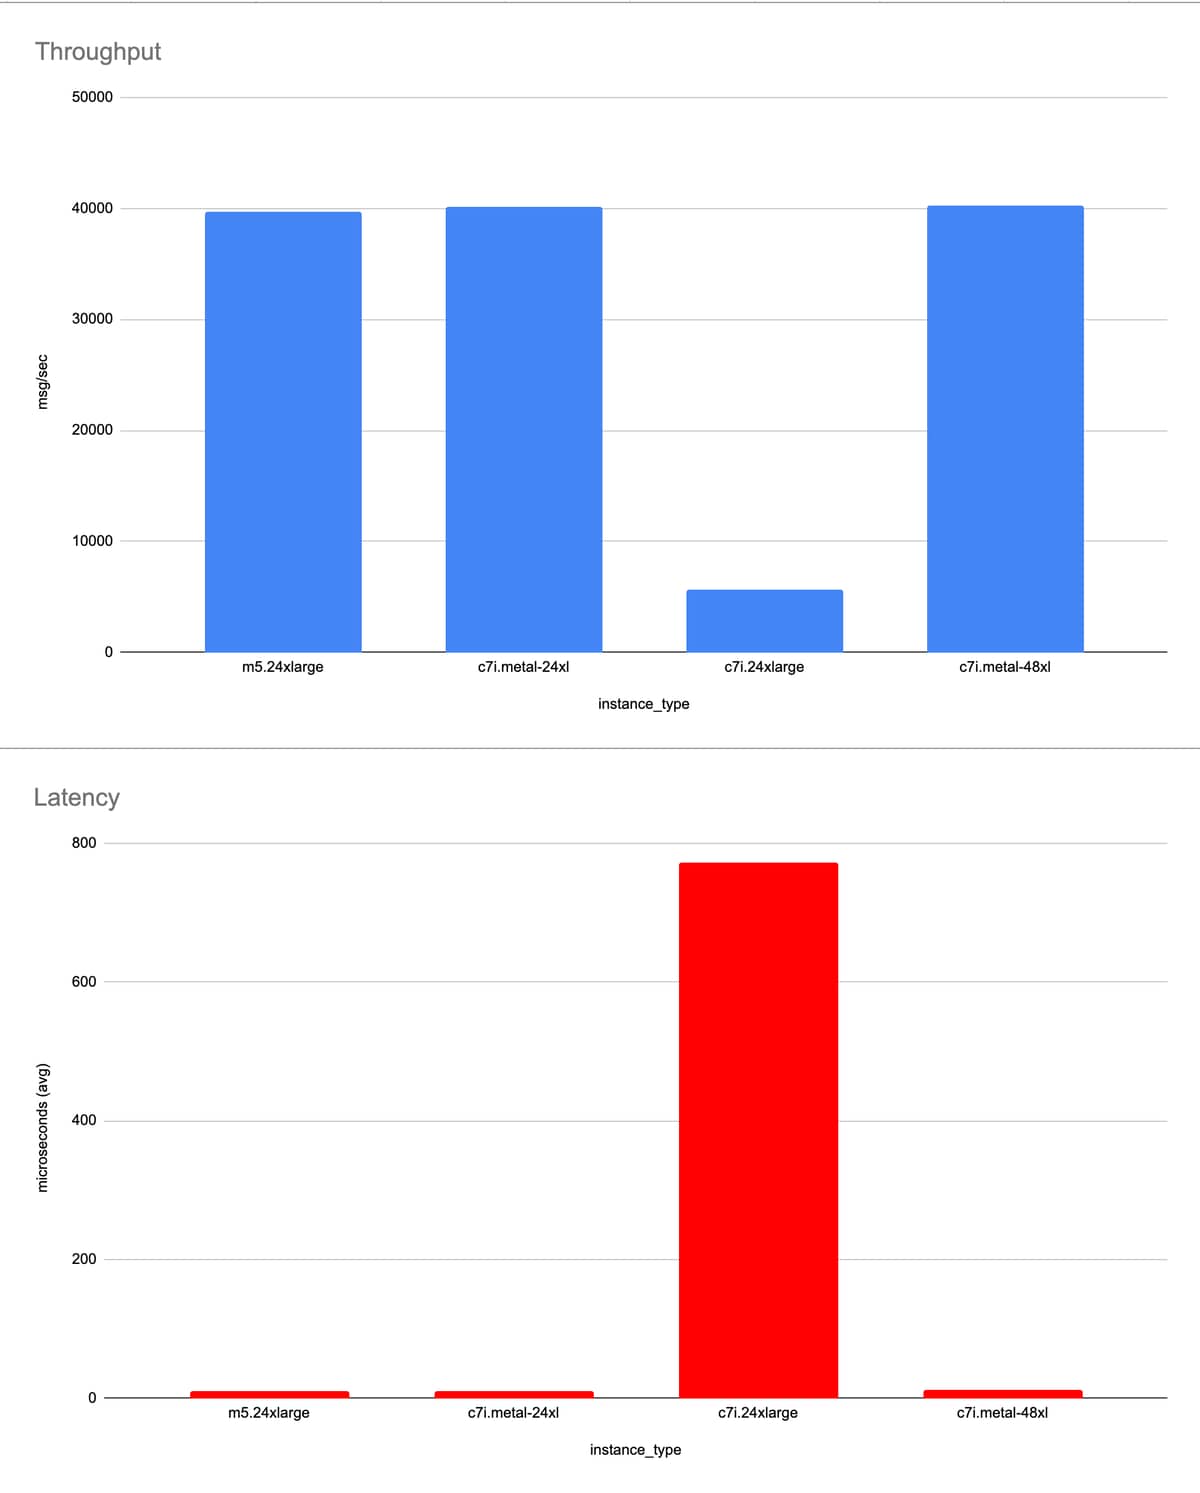
With 96 Erlang processes
Our takeaway: c7i.24xlarge enters a pathological state of some kind, but the workload is small enough that c7i.metal-48xl is still ok.
| instance_type | logical processors | Erlang procs | avg latency (us) | throughput (/s) | flushput (/s) | total (/s) |
|---|---|---|---|---|---|---|
| m5.24xlarge | 96 | 96 | 10 | 39695 | 2320 | 42015 |
| c7i.metal-24xl | 96 | 96 | 11 | 40109 | 1201 | 41310 |
| c7i.24xlarge | 96 | 96 | 772 | 5620 | 4074 | 9694 |
| c7i.metal-48xl | 192 | 96 | 12 | 40225 | 1026 | 41251 |
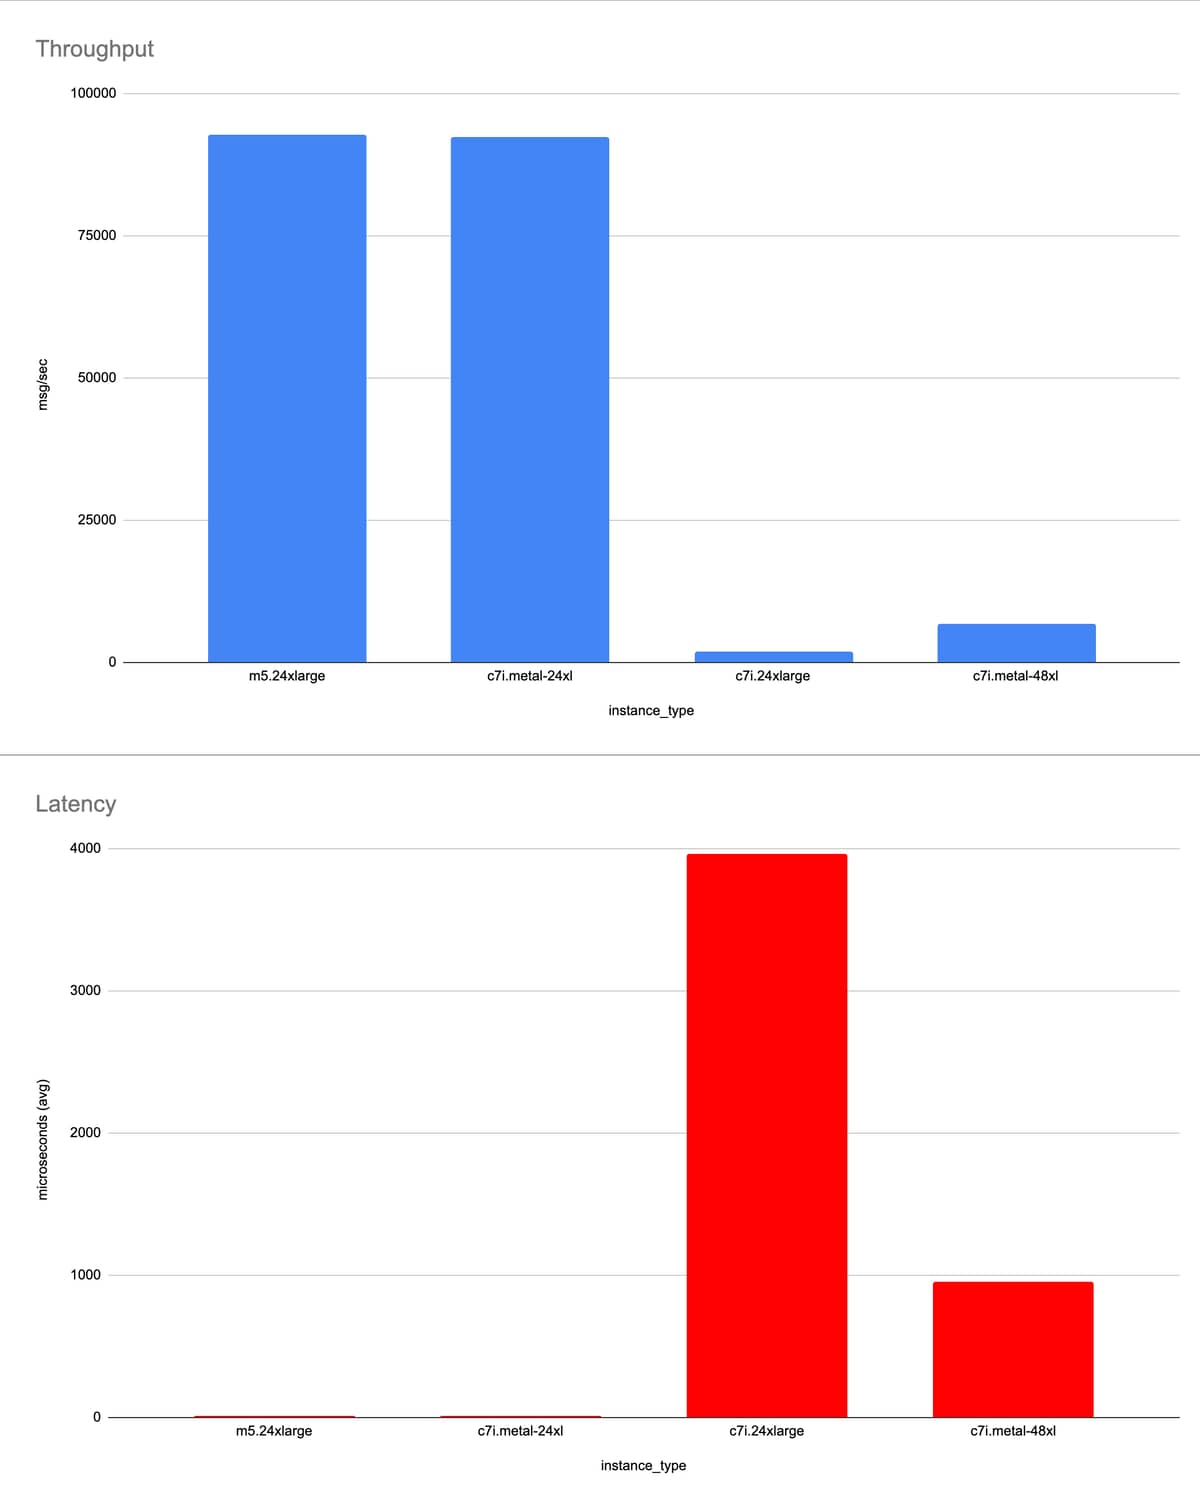
With 192 Erlang processes
Our takeaway: c7i.24xlarge is struggling heavily. The workload has grown to a size that causes c7i.metal-48xl to slow.
| instance_type | logical processors | Erlang procs | avg latency (us) | throughput (/s) | flushput (/s) | total (/s) |
|---|---|---|---|---|---|---|
| m5.24xlarge | 96 | 192 | 8 | 92782 | 1297 | 94073 |
| c7i.metal-24xl | 96 | 192 | 8 | 92404 | 1349 | 93753 |
| c7i.24xlarge | 96 | 192 | 3962 | 1987 | 4081 | 6068 |
| c7i.metal-48xl | 192 | 192 | 957 | 6779 | 3456 | 10245 |
Other Observations
The pathological state isn’t immediate. It takes about 5 minutes to reliably get the system into the state described above. The numbers for our benchmarks were measured after this 5 minute warming period.
Scheduler Utilization during poor performance
With c7i.24xlarge as the poorest performer, we collected scheduler utilization data (scheduler:utilization/1) during the 96-proc benchmark run.
A small number of schedulers are at 100% while others are idle.
Interestingly, we tried changing the schedulers_online from 96 to 24 – doing so causes all 24 schedulers to become busy again. This reminded us of the old issue of so-called “scheduler collapse”, but otherwise we don’t have evidence that it’s the same problem.
{total,0.10934912048525097,"10.9%"}
{weighted,0.21869824097050194,"21.9%"}
{normal,1,1.0,"100.0%"}
{normal,2,1.0,"100.0%"}
{normal,3,5.58303566227387e-6,"0.0%"}
{normal,4,1.0,"100.0%"}
{normal,5,1.0,"100.0%"}
{normal,6,1.0,"100.0%"}
{normal,7,5.126323292650903e-6,"0.0%"}
{normal,8,1.0,"100.0%"}
{normal,9,1.0,"100.0%"}
{normal,10,1.0,"100.0%"}
{normal,11,1.0,"100.0%"}
{normal,12,4.906183199608674e-6,"0.0%"}
{normal,13,1.0,"100.0%"}
{normal,14,1.0,"100.0%"}
{normal,15,1.0,"100.0%"}
{normal,16,1.0,"100.0%"}
{normal,17,1.0,"100.0%"}
{normal,18,1.0,"100.0%"}
{normal,19,1.0,"100.0%"}
{normal,20,1.0,"100.0%"}
{normal,21,1.0,"100.0%"}
{normal,22,1.0,"100.0%"}
{normal,23,1.0,"100.0%"}
{normal,24,1.0,"100.0%"}
{normal,25,6.259780657377271e-6,"0.0%"}
{normal,26,5.496938458024259e-6,"0.0%"}
{normal,27,6.305404208768346e-6,"0.0%"}
{normal,28,5.621689947452118e-6,"0.0%"}
{normal,29,5.165565996041186e-6,"0.0%"}
{normal,30,5.305773543597241e-6,"0.0%"}
{normal,31,4.920218743583807e-6,"0.0%"}
{normal,32,5.758529109259419e-6,"0.0%"}
{normal,33,5.58164412163277e-6,"0.0%"}
{normal,34,4.950861226300747e-6,"0.0%"}
{normal,35,5.877247079485125e-6,"0.0%"}
{normal,36,5.97810106243979e-6,"0.0%"}
{normal,37,5.891971392599641e-6,"0.0%"}
{normal,38,5.447215499276138e-6,"0.0%"}
{normal,39,4.617056319070007e-6,"0.0%"}
{normal,40,7.2914062498871724e-6,"0.0%"}
{normal,41,5.1784460943365516e-6,"0.0%"}
{normal,42,5.787004545484994e-6,"0.0%"}
{normal,43,5.180002114471294e-6,"0.0%"}
{normal,44,4.616060171962071e-6,"0.0%"}
{normal,45,4.417586414659817e-6,"0.0%"}
{normal,46,5.8317519058503196e-6,"0.0%"}
{normal,47,5.504460186548103e-6,"0.0%"}
{normal,48,5.309437124675028e-6,"0.0%"}
{normal,49,5.429387892760399e-6,"0.0%"}
{normal,50,4.985876345064144e-6,"0.0%"}
{normal,51,6.384960497472964e-6,"0.0%"}
{normal,52,4.487253079293929e-6,"0.0%"}
{normal,53,2.0572776595553175e-6,"0.0%"}
{normal,54,6.006224830088852e-6,"0.0%"}
{normal,55,5.195931865992904e-6,"0.0%"}
{normal,56,5.5647373711127905e-6,"0.0%"}
{normal,57,5.201120156378307e-6,"0.0%"}
{normal,58,5.3847504734739995e-6,"0.0%"}
{normal,59,6.198964288353352e-6,"0.0%"}
{normal,60,4.3640235625754655e-6,"0.0%"}
{normal,61,4.531318243637775e-6,"0.0%"}
{normal,62,6.4350917892342455e-6,"0.0%"}
{normal,63,5.305698076441054e-6,"0.0%"}
{normal,64,5.858108511519475e-6,"0.0%"}
{normal,65,5.444306540754987e-6,"0.0%"}
{normal,66,4.346515118146357e-6,"0.0%"}
{normal,67,6.384108996950193e-6,"0.0%"}
{normal,68,4.779536226699929e-6,"0.0%"}
{normal,69,4.193538528757371e-6,"0.0%"}
{normal,70,7.48615386777243e-6,"0.0%"}
{normal,71,5.434803709470685e-6,"0.0%"}
{normal,72,4.86929483832563e-6,"0.0%"}
{normal,73,2.899459099867281e-6,"0.0%"}
{normal,74,4.63330867595908e-6,"0.0%"}
{normal,75,5.115959533735618e-6,"0.0%"}
{normal,76,4.9098615492426465e-6,"0.0%"}
{normal,77,5.233361507930516e-6,"0.0%"}
{normal,78,5.502109724074743e-6,"0.0%"}
{normal,79,5.84897662924456e-6,"0.0%"}
{normal,80,4.41919119358856e-6,"0.0%"}
{normal,81,5.630379932187433e-6,"0.0%"}
{normal,82,5.280271742549084e-6,"0.0%"}
{normal,83,4.759883832735486e-6,"0.0%"}
{normal,84,5.567368124376901e-6,"0.0%"}
{normal,85,2.76068218559842e-6,"0.0%"}
{normal,86,4.585415769074829e-6,"0.0%"}
{normal,87,3.8648374777872e-6,"0.0%"}
{normal,88,2.1733507378973854e-6,"0.0%"}
{normal,89,3.853097110405978e-6,"0.0%"}
{normal,90,5.812516759883333e-6,"0.0%"}
{normal,91,5.2112435821372965e-6,"0.0%"}
{normal,92,4.980230689222788e-6,"0.0%"}
{normal,93,5.253219365755038e-6,"0.0%"}
{normal,94,5.201969216855129e-6,"0.0%"}
{normal,95,4.707100637002602e-6,"0.0%"}
{normal,96,4.8749385197686555e-6,"0.0%"}
{cpu,97,0.0,"0.0%"}
{cpu,98,0.0,"0.0%"}
{cpu,99,0.0,"0.0%"}
{cpu,100,0.0,"0.0%"}
{cpu,101,0.0,"0.0%"}
{cpu,102,0.0,"0.0%"}
{cpu,103,0.0,"0.0%"}
{cpu,104,0.0,"0.0%"}
{cpu,105,0.0,"0.0%"}
{cpu,106,0.0,"0.0%"}
{cpu,107,0.0,"0.0%"}
{cpu,108,0.0,"0.0%"}
{cpu,109,0.0,"0.0%"}
{cpu,110,0.0,"0.0%"}
{cpu,111,0.0,"0.0%"}
{cpu,112,0.0,"0.0%"}
{cpu,113,0.0,"0.0%"}
{cpu,114,0.0,"0.0%"}
{cpu,115,0.0,"0.0%"}
{cpu,116,0.0,"0.0%"}
{cpu,117,0.0,"0.0%"}
{cpu,118,0.0,"0.0%"}
{cpu,119,0.0,"0.0%"}
{cpu,120,0.0,"0.0%"}
{cpu,121,0.0,"0.0%"}
{cpu,122,0.0,"0.0%"}
{cpu,123,0.0,"0.0%"}
{cpu,124,0.0,"0.0%"}
{cpu,125,0.0,"0.0%"}
{cpu,126,0.0,"0.0%"}
{cpu,127,0.0,"0.0%"}
{cpu,128,0.0,"0.0%"}
{cpu,129,0.0,"0.0%"}
{cpu,130,0.0,"0.0%"}
{cpu,131,0.0,"0.0%"}
{cpu,132,0.0,"0.0%"}
{cpu,133,0.0,"0.0%"}
{cpu,134,0.0,"0.0%"}
{cpu,135,0.0,"0.0%"}
{cpu,136,0.0,"0.0%"}
{cpu,137,0.0,"0.0%"}
{cpu,138,0.0,"0.0%"}
{cpu,139,0.0,"0.0%"}
{cpu,140,0.0,"0.0%"}
{cpu,141,0.0,"0.0%"}
{cpu,142,0.0,"0.0%"}
{cpu,143,0.0,"0.0%"}
{cpu,144,0.0,"0.0%"}
{cpu,145,0.0,"0.0%"}
{cpu,146,0.0,"0.0%"}
{cpu,147,0.0,"0.0%"}
{cpu,148,0.0,"0.0%"}
{cpu,149,0.0,"0.0%"}
{cpu,150,0.0,"0.0%"}
{cpu,151,0.0,"0.0%"}
{cpu,152,0.0,"0.0%"}
{cpu,153,0.0,"0.0%"}
{cpu,154,0.0,"0.0%"}
{cpu,155,0.0,"0.0%"}
{cpu,156,0.0,"0.0%"}
{cpu,157,0.0,"0.0%"}
{cpu,158,0.0,"0.0%"}
{cpu,159,0.0,"0.0%"}
{cpu,160,0.0,"0.0%"}
{cpu,161,0.0,"0.0%"}
{cpu,162,0.0,"0.0%"}
{cpu,163,0.0,"0.0%"}
{cpu,164,0.0,"0.0%"}
{cpu,165,0.0,"0.0%"}
{cpu,166,0.0,"0.0%"}
{cpu,167,0.0,"0.0%"}
{cpu,168,0.0,"0.0%"}
{cpu,169,0.0,"0.0%"}
{cpu,170,0.0,"0.0%"}
{cpu,171,0.0,"0.0%"}
{cpu,172,0.0,"0.0%"}
{cpu,173,0.0,"0.0%"}
{cpu,174,0.0,"0.0%"}
{cpu,175,0.0,"0.0%"}
{cpu,176,0.0,"0.0%"}
{cpu,177,0.0,"0.0%"}
{cpu,178,0.0,"0.0%"}
{cpu,179,0.0,"0.0%"}
{cpu,180,0.0,"0.0%"}
{cpu,181,0.0,"0.0%"}
{cpu,182,0.0,"0.0%"}
{cpu,183,0.0,"0.0%"}
{cpu,184,0.0,"0.0%"}
{cpu,185,0.0,"0.0%"}
{cpu,186,0.0,"0.0%"}
{cpu,187,0.0,"0.0%"}
{cpu,188,0.0,"0.0%"}
{cpu,189,0.0,"0.0%"}
{cpu,190,0.0,"0.0%"}
{cpu,191,0.0,"0.0%"}
{cpu,192,0.0,"0.0%"}
What we’ve tried so far
- We’ve tried different settings of erl flags
+sbt,+sbwt,+sclto no avail. The same behavior is present - We’ve inspected the Linux system outside of the BEAM and didn’t see any evidence that the system as whole is affected
- We are attempting to confirm with AWS that the underlying hardware is configured with optimal settings. Nothing to report at this time.
Help
Where do we go next? Any hints on debugging tools in Erlang or Linux that would reveal more information? Is an OTP GitHub issue prudent?
Thanks!