I am a game developer, and we have a process where many game configuration are converted into Erlang files, compiled, and then hot-updated to the prod environment. We have a monitoring process on the server that periodically checks for processes with consistently high total_heap_size. We have noticed that sometimes, after hot-updating the configuration files, the total_heap_size of certain active processes suddenly becomes very high, around 50MB to 60MB, and this value is the same across all server nodes. I have confirmed that the affected processes are not making any calls to these hot-updated files. The total_heap_size only decreases when we manually invoke “erlang:garbage_collect/1” on them; otherwise, they continue to maintain the same size of total_heap_size. This phenomenon has left me puzzled. Can you please advise on how we can locate and resolve this issue?
I think we need a little more information. Some initial questions I myself have :
This sounds like you have some config (maybe yaml, json, etc) and you convert into erlang terms baked into an erlang module, is that correct?
What size are these active processes prior to code reload?
Would there be interactions between other processes and said active processes when new config is put in place? Perhaps, the active processes which see in increase in heap size get a messages at this time with decent sized data (doesn’t have to be large!)?
The active processes effected do not touch the files directly, but would they be referencing any of the terms provided by config modules?
Yes, we will convert each category of game parameter configuration into an Erlang record and create a separate Erlang file. For example (cfg_a.erl):
-module(cfg_a).
-include(“cfg_a.hrl”).
-export([get/1]).
get(1) → #aCfg{id=1,p1=x1,p2=y1,p3=z1};
get(2) → #aCfg{id=2,p1=x2,p2=y2,p3=z2}.
The size of these configurations varies depending on their functions.
Before reloading the code, the heap size of the process is around 3M to slightly over 10M. After executing the hot reload command, it reaches around 50M+.
It is highly likely that there is no interaction because these files need to be triggered by corresponding logic to be called. Even if I do nothing but reload the code, the heap size will immediately increase.
4.Upon further observation, sometimes the affected processes do call the file, while other times there is no obvious invocation (given the large codebase, I cannot guarantee that there are no indirect references). Perhaps we can first consider the scenario where we hot update a configuration module that the process frequently calls.
Additionally, I’d like to provide some additional information: When the configuration files for hot reloading are large, this issue is bound to occur. In this test, the .erl file size is 33MB, and the compiled .beam file is 1.1MB.
I apologize for any shortcomings in my English expression. If you have any questions, please let me know, and I will provide further clarification.
After replacing the .beam file, when you execute code:load_file/1 , the heap memory does not increase. However, when you later call code:soft_purge/1 , the heap memory of the process increases to over 50MB.
This is probably because after cfg is reloaded, the address in the memory has changed, and the processes that have previously stored the cfg address are only shallow copies. Naturally, changing the address will cause the deep copy memory to increase.
There is a possibility that when I invoke code:soft_purge/1, the heap memory increases because the old code is removed, and all processes need to perform deep copying. Previously, they might have only held references to addresses. Is there any good solution to this problem because it can lead to a sudden increase in memory, which carries a significant risk?
Is there a reason to do this over using persistent_term – which afaik does something similar and was built exactly to cover the usecase where people previously built modules at runtime.
Avoid permanently storing large amounts of cfg data in process memory (such as state or process dictionary)
Periodically perform active process gc on idle processes, which can GC out most of the processes that have temporarily not released the cfg shallow copy data. Naturally, when the new cfg reloaded, the deep copy will not be triggered.
The cfg data is not stored in memory. We only retrieve this data through function calls, such as acfg:get(Key).
The timing of GC for memory release is delayed. However, in the current situation, after a hot update, the memory may immediately surge. If the memory is low, a large amount of swap memory may be requested suddenly, severely impacting server performance.
Indeed. What should be happening here is you are referencing the literals in your configuration module, and you get those for free (i.e., pointers). You then load up a new version of your config module and do a purge, now those values must be copied into the proc heap (any proc referencing). I believe that is correct.
The same thing can happen with persistent_term as well.
You can test the above hypothesis terribly easy :
create a gen_server making a call to your configuration module in init
hold on to the return value from the config module in state.
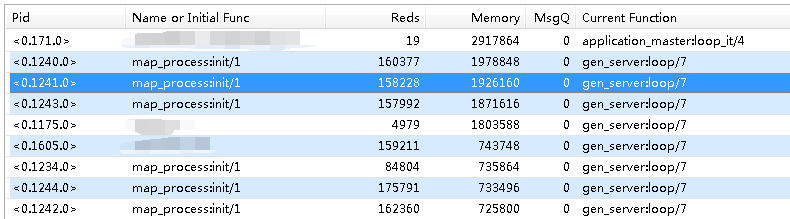
Let that churn for a bit to observe that the memory foot print of the process is small and != the size of the term referenced in the config module.
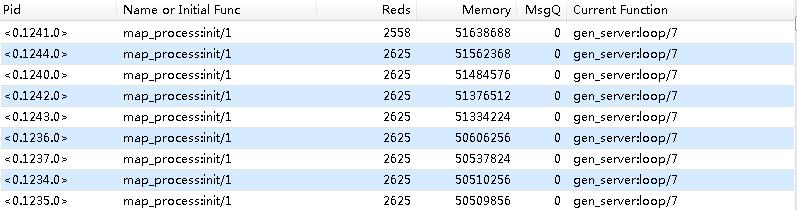
Perform a code:load_file/1 followed by code:purge/1 (twice)
You should see a significant increase in the memory foot print of the process. Mind you, the term must be large (enough).